Chapter: Civil : Structural dynamics of earthquake engineering
Velestos and Newmark spectra
Combined deformation,
velocity and acceleration (DVA) spectrum
Each of the deformation
pseudo-velocity and pseudo-acceleration response spectra for given ground
motion contains the same information, no more no less. The three different
spectra are simply different ways of presenting the same information on the
structural response. Knowing one of the spectra, the other two can be obtained
by algebraic operation.
Then why do we need three
spectra? Each one gives different physical meanings. The deformation spectrum
directly provides peak deformation of the system. The pseudo-velocity spectrum
gives peak strain energy stored in the system. The pseudo-acceleration spectrum
is related directly to the peak value of the equivalent static force and base
shear. For this purpose a combined plot showing all three of the spectral
quantities is especially useful. This type of plot was developed by A S Velestos
and N M Newmark in 1960 for earthquake response.
Velestos and Newmark spectra
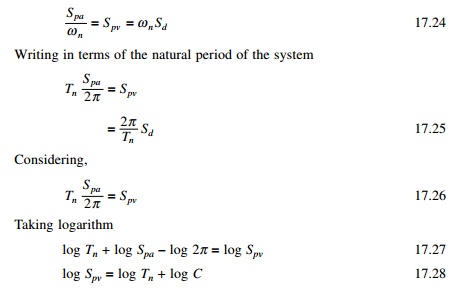
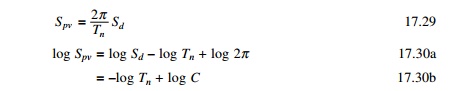
The relationship between pseudo-spectral acceleration,
pseudo-spectral velocity and spectral displacement may be written as (shown in
Fig. 17.14)
The curve between log Spv and log Tn
is a straight line with +45° slope
for which Spa is constant. Hence the slope of log Spa
is –45°.
Hence log Spv vs. log Tn
line is a straight line with – ve slope of 45°. Hence Sd
line is constant at an angle of +45°.
Once the graph paper has been
constructed, the three responses of deformation, pseudo-velocity and
pseudo-acceleration of Fig. 17.15 can readily be combined into one plot. For
example V = 596.9 mm/s for Tn = 2 s is plotted and the
corresponding Sd = 189.7 mm and Spa = 0.191g
is read from the graph. The four-way plot is a complete presentation of
deformation, pseudo-velocity and pseudo-acceleration plots.
A response spectrum should cover
a wide range of natural periods and several damping values so that it provides
a peak response for all possible structures. The period range should be
extended because tall buildings and long bridges may have longer vibration
periods and several damping ratios will need to be included from 0 to 20% over
a period range of 0.2 to 50 s. The response spectrum has proved to be very
useful in earthquake engineering for all ground motions.
Related Topics