Chapter: Fundamentals of Database Systems : Conceptual Modeling and Database Design : Practical Database Design Methodology and Use of UML Diagrams
Use of UML Diagrams as an Aid to Database Design Specification
Use of UML Diagrams as an Aid to Database Design Specification
1. UML as a Design
Specification Standard
There is a need of some standard approach to cover the entire spectrum
of requirements analysis, modeling, design, implementation, and deployment of
databases and their applications. One approach that is receiving wide attention
and that is also proposed as a standard by the Object Management Group (OMG) is
the Unified Modeling Language (UML) approach. It provides a mechanism in the
form of dia-grammatic notation and associated language syntax to cover the
entire life cycle. Presently, UML can be used by software developers, data
modelers, database design-ers, and so on to define the detailed specification
of an application. They also use it to specify the environment consisting of
users, software, communications, and hardware to implement and deploy the
application.
UML combines commonly accepted concepts from many object-oriented (O-O)
methods and methodologies (see this chapter’s Selected Bibliography for the
contributing methodologies that led to UML). It is generic, and is
language-independent and platform-independent. Software architects can model
any type of application, running on any operating system, programming language,
or network, in UML. That has made the approach very widely applicable. Tools
like Rational Rose are currently popular for drawing UML diagrams—they enable
software developers to develop clear and easy-to-understand models for
specifying, visualizing, constructing, and documenting components of software
systems. Since the scope of UML extends to software and application development
at large, we will not cover all aspects of UML here. Our goal is to show some
relevant UML notations that are commonly used in the requirements collection and
analysis phase of database design, as well as the conceptual design phase (see
Phases 1 and 2 in Figure 10.1). A detailed application development methodology
using UML is outside the scope of this book and may be found in various
textbooks devoted to object-oriented design, software engineering, and UML (see
the Selected Bibliography at the end of this chapter).
UML has many types of diagrams. Class
diagrams, which can represent the end result of conceptual database design,
were discussed in Sections 7.8 and 8.6. To arrive at the class diagrams, the
application requirements may be gathered and specified using use case diagrams, sequence diagrams, and statechart
diagrams. In the rest of this section we introduce the different types of
UML diagrams briefly to give the reader an idea of the scope of UML. Then we
describe a small sample application to illustrate the use of some of these
diagrams and show how they lead to the eventual class diagram as the final
conceptual database design. The diagrams presented in this section pertain to
the standard UML notation and have been drawn using Rational Rose. Section 10.4
is devoted to a general discussion of the use of Rational Rose in database
application design.
2. UML for Database
Application Design
UML was developed as a software engineering methodology. As we mentioned
earlier in Section 7.8, most software systems have sizable database
components. The database community has started embracing UML, and now some
database designers and developers are using UML for data modeling as well as
for subsequent phases of database design. The advantage of UML is that even
though its concepts are based on object-oriented techniques, the resulting
models of structure and behavior can be used to design relational, object-oriented,
or object-relational databases (see Chapter 11 for definitions of object
databases and object-relational databases).
One of the major contributions of the UML approach has been to bring the
traditional database modelers, analysts, and designers together with the
software application developers. In Figure 10.1 we showed the phases of
database design and implementation and how they apply to these two groups. UML
also allows us to do behavioral, functional, and dynamic modeling by
introducing various types of dia-grams. This results in a more complete
specification/description of the overall data-base application. In the
following sections we summarize the different types of UML diagrams and then
give an example of the use case, sequence, and statechart diagrams in a sample
application.
3. Different Types of
Diagrams in UML
UML defines nine types of diagrams divided into these two categories:
Structural Diagrams. These
describe the structural or static relationships among schema objects, data objects, and software components. They
include class diagrams, object diagrams, component diagrams, and deployment
diagrams.
Behavioral Diagrams. Their purpose is to describe the behavioral or dynamic relationships among components. They include use case
diagrams, sequence diagrams, collaboration diagrams, statechart diagrams, and
activity diagrams.
We introduce the nine types briefly below. The structural diagrams include:
A. Class Diagrams. Class diagrams capture the static structure of the system and act as foundation for other models. They show classes, interfaces,
collaborations, dependencies, generalizations, associations, and other
relationships. Class diagrams are a very useful way to model the conceptual
database schema. We showed examples of class diagrams for the COMPANY database
schema in Figure 7.16 and for a generalization hierarchy in Figure 8.10.
Package Diagrams. Package diagrams are a subset of class diagrams. They organize elements of the system into related groups called packages. A package may be a collection of related classes and the
relationships between them. Package diagrams help minimize dependencies in a
system.
Object Diagrams. Object diagrams show a set of
individual objects and their relationships, and are sometimes
referred to as instance diagrams.
They give a static view of a system at a particular time and are normally used
to test class diagrams for accuracy.
Component Diagrams. Component diagrams illustrate the
organizations and
dependencies among software components. A component
diagram typically consists of components, interfaces, and dependency
relationships. A component may be a source code component, a runtime component,
or an executable component. It is a physical building block in the system and
is represented as a rectangle with two small rectangles or tabs overlaid on its
left side. An interface is a group
of operations used or created by a component and is usually represented by a
small circle. Dependency relationship is used to model the relationship between
two components and is represented by a dotted arrow pointing from a component
to the component it depends on. For databases, component diagrams stand for
stored data such as tablespaces or partitions. Interfaces refer to applications
that use the stored data.
Deployment Diagrams. Deployment diagrams represent the
distribution of
components (executables, libraries, tables, files)
across the hardware topology. They depict the physical resources in a system,
including nodes, components, and connections, and are basically used to show
the configuration of runtime processing elements (the nodes) and the software
processes that reside on them (the threads).
Next, we briefly describe the various types of behavioral diagrams and expand on those that are of particular
interest.
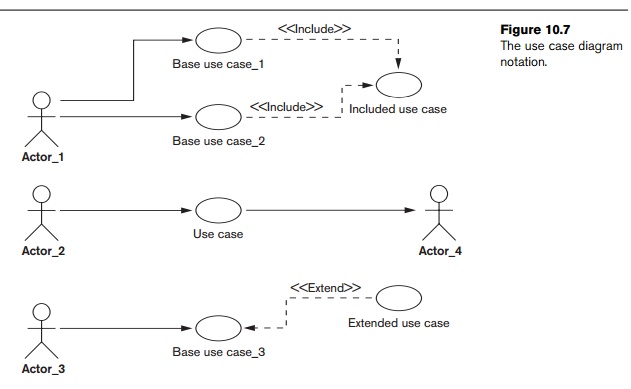
E. Use Case Diagrams. Use case diagrams are used to model the functional interactions between users and the system. A scenario is a sequence of steps describing an interaction between
a user and a system. A use case is a
set of scenarios that have a common goal. The use case diagram was introduced
by Jacobson to visualize use cases. A use
case diagram shows actors interacting with use cases and can be understood
easily without the knowledge of any notation. An individual use case is shown
as an oval and stands for a specific task performed by the system. An actor, shown with a stick person
symbol, represents an external user, which may be a human user, a
representative group of users, a certain role of a person in the organ-ization,
or anything external to the system (see Figure 10.7). The use case diagram
shows possible interactions of the system (in our case, a database system) and
describes as use cases the specific tasks the system performs. Since they do
not spec-ify any implementation detail and are supposed to be easy to
understand, they are used as a vehicle for communicating between the end users
and developers to help in easier user validation at an early stage. Test plans
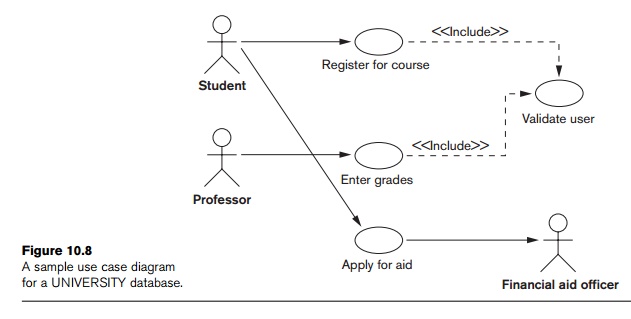
can also be described using use case diagrams. Figure 10.7 shows the use case
diagram notation. The include
rela-tionship is used to factor out some common behavior from two or more of
the orig-inal use cases—it is a form of reuse. For example, in a university
environment shown in Figure 10.8, the use cases Register for course and Enter
grades in which the actors student and professor are involved, include a
common use case called Validate user.
If a use case incorporates two or more significantly different scenarios, based on circumstances or varying
conditions, the extend relationship
is used to show the subcases attached to the base case.
Interaction Diagrams. The next two types of UML behavioral diagrams, interaction diagrams, are used to model the dynamic aspects of a system. They consist of a
set of messages exchanged between a
set of objects. There are two types of interaction diagrams, sequence and
collaboration.
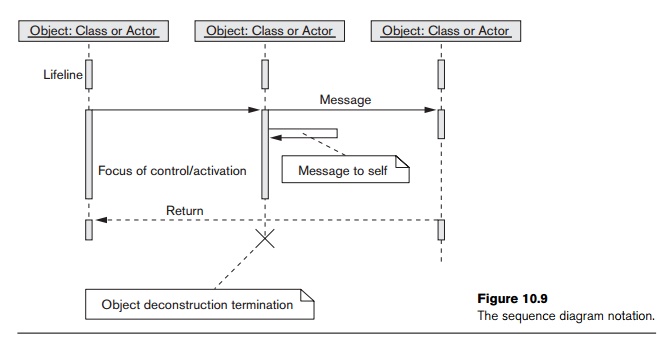
F. Sequence Diagrams. Sequence diagrams describe the interactions between various objects over time. They basically give a dynamic view of the system by showing the flow of messages between objects. Within the sequence diagram, an object or an actor is shown as a box at the top of a dashed vertical line, which is called the object’s lifeline. For a database, this object is typically something physical—a book in a warehouse that would be represented in the database, an external document or form such as an order form, or an external visual screen—that may be part of a user interface. The lifeline represents the existence of an object over time. Activation, which indicates when an object is performing an action, is represented as a rectangular box on a lifeline. Each message is represented as an arrow between the lifelines of two objects. A message bears a name and may have arguments and control information to explain the nature of the interaction. The order of messages is read from top to bottom. A sequence diagram also gives the option of self-call, which is basically just a message from an object to itself. Condition and Iteration markers can also be shown in sequence diagrams to specify when the message should be sent and to specify the condition to send multiple markers. A return dashed line shows a return from the message and is optional unless it carries a special meaning. Object deletion is shown with a large X. Figure 10.9 explains some of the notation used in sequence diagrams.
G. Collaboration Diagrams. Collaboration diagrams represent interactions among objects as a series of sequenced messages. In collaboration
diagrams the emphasis is on the structural organization of the objects that
send and receive mes-sages, whereas in sequence diagrams the emphasis is on the
time-ordering of the messages. Collaboration diagrams show objects as icons and
number the messages; numbered messages represent an ordering. The spatial
layout of collaboration dia-grams allows linkages among objects that show their
structural relationships. Use of collaboration and sequence diagrams to
represent interactions is a matter of choice as they can be used for somewhat
similar purposes; we will hereafter use only sequence diagrams.
H. Statechart Diagrams. Statechart diagrams describe how an object’s state changes in response to external events.
To describe the behavior of an object, it is common in most
object-oriented tech-niques to draw a statechart diagram to show all the
possible states an object can get into in its lifetime. The UML statecharts are
based on David Harel’s statecharts. They show a state machine consisting of states,
transitions, events, and actions and are very useful in the conceptual design
of the application that works against a data-base of stored objects.
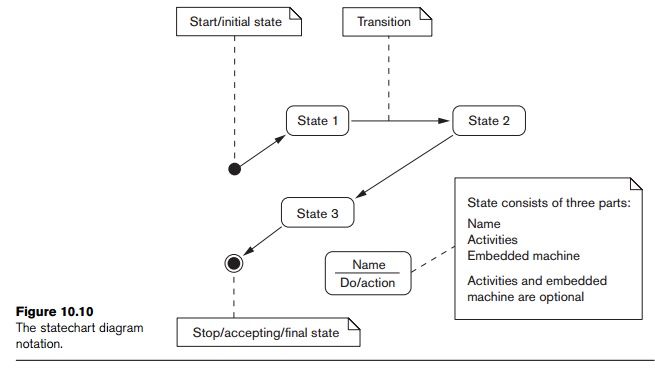
The important elements of a statechart diagram shown in Figure 10.10 are
as follows:
States. Shown as boxes with rounded
corners, they represent situations in the
lifetime of an object.
Transitions. Shown as solid arrows between the
states, they represent the paths
between different states of an object. They are labeled by the event-name
[guard] /action; the event triggers the transition and the action results from
it. The guard is an additional and optional condition that specifies a
condition under which the change of state may not occur.
Start/Initial State. Shown by
a solid circle with an outgoing arrow to a state.
Stop/Final State. Shown as a double-lined filled
circle with an arrow pointing into it from a state.
Statechart diagrams are useful in specifying how an object’s reaction to
a message depends on its state. An event
is something done to an object such as receiving a message; an action is something that an object does
such as sending a message.
I. Activity Diagrams. Activity diagrams present a dynamic view of the system by modeling the flow of control from activity to activity. They can be considered
as flowcharts with states. An activity
is a state of doing something, which could be a real-world process or an
operation on some object or class in the database. Typically, activity diagrams
are used to model workflow and internal business oper-ations for an
application.
4. A Modeling and Design Example: UNIVERSITY Database
In this section we will briefly illustrate the use of some of the UML
diagrams we presented above to design a simple database in a university
setting. A large number of details are left out to conserve space; only a
stepwise use of these diagrams that leads toward a conceptual design and the
design of program components is illustrated. As we indicated before, the
eventual DBMS on which this database gets implemented may be relational,
object-oriented, or object-relational. That will not change the stepwise
analysis and modeling of the application using the UML diagrams.
Imagine a scenario with students enrolling in courses that are offered
by professors. The registrar’s office is in charge of maintaining a schedule of
courses in a course catalog. They have the authority to add and delete courses
and to do schedule changes. They also set enrollment limits on courses. The
financial aid office is in charge of processing student aid applications for
which the students have to apply. Assume that we have to design a database that
maintains the data about students, professors, courses, financial aid, and so
on. We also want to design some of the applications that enable us to do course
registration, financial aid application processing, and maintaining of the
university-wide course catalog by the registrar’s office. The above
requirements may be depicted by a series of UML diagrams.
As mentioned previously, one of the first steps involved in designing a
database is to gather customer requirements by using use case diagrams. Suppose one of the requirements in the
UNIVERSITY database is to allow the professors to enter grades for the courses
they are teaching and for the students to be able to register for courses and
apply for financial aid. The use case diagram corresponding to these use cases
can be drawn as shown in Figure 10.8.
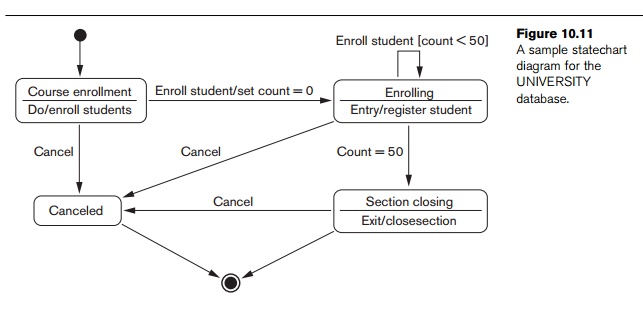
Another helpful element when designing a system is to graphically
represent some of the states the system can be in, to visualize the various
states the system can be in during the course of an application. For example,
in our UNIVERSITY database the various states that the system goes through when
the registration for a course with 50 seats is opened can be represented by the
statechart diagram in Figure 10.11.
This shows the states of a course while enrollment is in process. The first
state sets the count of students enrolled to zero. During the enrolling state,
the Enroll student transition
continues as long as the count of enrolled students is less than 50. When the
count reaches 50, the state to close the section is entered. In a real system,
additional states and/or transitions could be added to allow a student to drop
a section and any other needed actions.
Next, we can design a sequence diagram to visualize the execution of the
use cases. For the university database, the sequence diagram corresponds to the
use case: student requests to register
and selects a particular course to register is shown in Figure
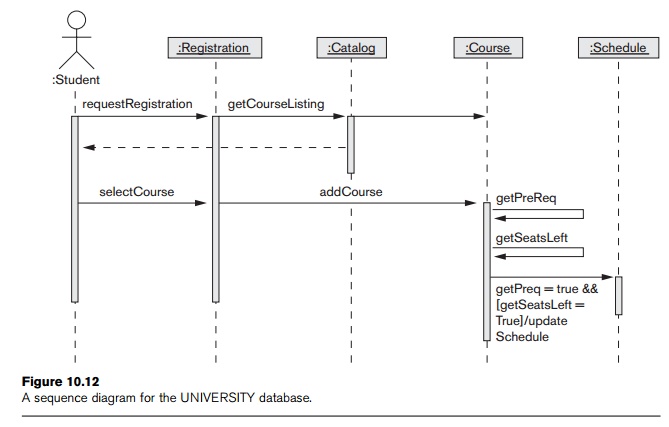
10.12. The catalog is first browsed to get course listings. Then, when
the student selects a course to register in, prerequisites and course capacity
are checked, and the course is then added to the student’s schedule if the
prerequisites are met and there is space in the course.
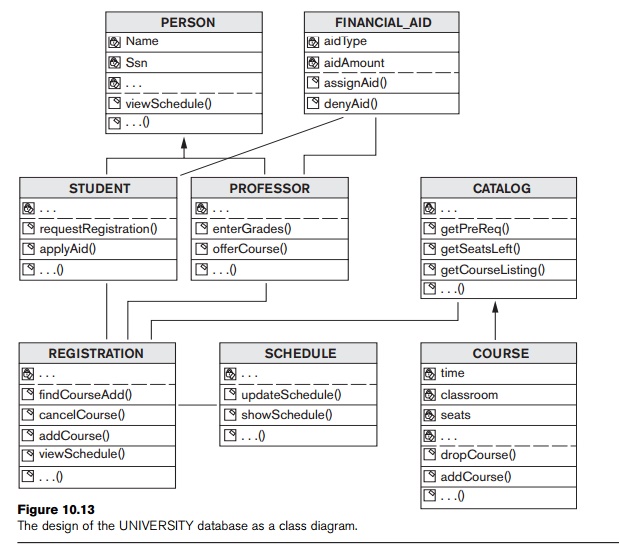
These UML diagrams are not the
complete specification of the UNIVERSITY data-base. There will be other use
cases for the various applications of the actors, including registrar,
student, professor, and so on. A complete methodology for how to arrive at the
class diagrams from the various diagrams we illustrated in this section is
outside our scope here. Design methodologies remain a matter of judgment and
personal preferences. However, the designer should make sure that the class
diagram will account for all the specifications that have been given in the
form of the use cases, statechart, and sequence diagrams. The class diagram in
Figure 10.13 shows a possible class diagram for this application, with the
structural relationships and the operations within the classes. These classes
will need to be implemented to develop the UNIVERSITY database, and together
with the operations they will implement the complete class
schedule/enrollment/aid application. Only some of the attributes and methods
(operations) are shown in Figure 10.13. It is likely that these class diagrams
will be modified as more details are specified and more func-tions evolve in
the UNIVERSITY application.
Related Topics