Chapter: Introduction to Human Nutrition: Body Composition
Use and misuse of body composition data
Use and misuse of body composition data
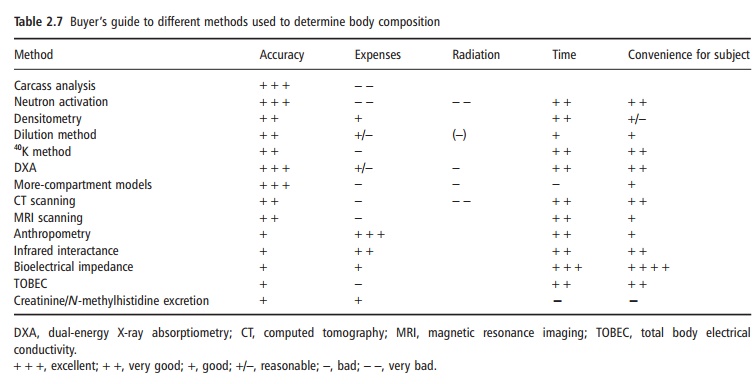
Information on the body composition of groups of subjects or individuals is important, as body composition is an indicator of nutritional status and also provides information about acute water homeostasis. Depending on what information is needed, several methods are available. However, all have their advan-tages and limitations. The price of the method (both the instrument and the required personnel), the eventual stress and danger (e.g., radiation) for the subject, and the time necessary to obtain the informa-tion determine the choice of the method, as well as the required accuracy. The use in epidemiological studies is different than that in clinical situations or in physiological research. Table 2.7 provides a “buyer’s guide” to the several methods discussed. It is difficult to generalize as to which method should be used in a given study. Apart from the factors mentioned in Table 2.7, availability plays an important role. Some situations are discussed below.
For the description of body fatness of a large general population group, the calculation of the body fat per-centage from the BMI may be as good as or even better than the more expensive information obtained from bioelectrical impedance or the laborious mea-surement of skinfold thicknesses. Whichever method is to be used for the prediction of body fat percentage in the population, it is important to remember that the formulae used should have been validated in the population under study. The fact that a formula is cross-validated by the authors who published the formula does not mean that the formula is valid in another population. The use of the Durnin and Womersley (1974) equations for estimating body fat from the sum of four skinfolds may be correct if the population is adult but younger than about 60 years. In older subjects, the amount of body fat is likely to be underestimated with these formulae. Therefore, their use and thoughtless interpretation in the elderly would lead to completely wrong conclusions about body composition in the elderly and changes in body composition with age. For the same reason, the BMI as an indicator of body fatness is only suitable when corrections for age and gender are made; for example, a BMI of 25 kg/m2 at the age of 20 years reflects a much lower percentage of body fat than at the age of 70 years. Body fat in females is always higher than body fat in males with the same BMI and age. Recent studies have shown that the relationship between BMI and body fat percentage also differs among ethnic groups. Figure 2.6 gives a good insight on how misleading a low BMI can be. The biodata also show the differences in body build, which is at least part of the reason for the paradox. Prediction equations based on impedance are dependent on body build, among other factors, and there are no universally valid prediction equations based on impedance. Choice of method to assess body composition in a population would also take into consideration within-and between-observer variability. Thus, impedance may be better than skinfold thickness measurements in a study of 1000 people, where variability between technicians is important. One may argue that, for population studies, a slight overestimation or under-estimation of body fat is not important. However, if, for example, obesity is defined as a certain amount of body fat that is achieved at a certain distinct level of BMI, even minor differences in body fat percentage or in BMI will result in large differences in the preva-lence of obesity.
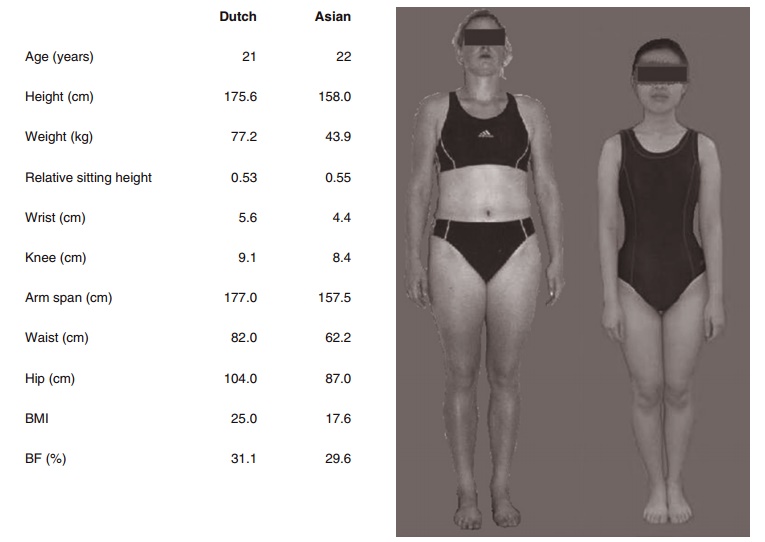
Figure 2.6 The difference in the relationship between BMI and body fat percentage across populations is best demonstrated in this figure and the given biodata. Note that the two young women are the same age and their percentage body fat as determined by a chemical four-compartment model (bias free!) is the same. The Asian woman has relatively shorter legs and a more slender body build (determined as height/(sum of knee and wrist diameter). Relative leg length and “slenderness” are main determining factors in the BMI/percentage body fat relationship in addition to physical activity level.
In physiological studies where, for example, energy metabolism has to be corrected for body composition, a systematic bias in body composition results may lead to completely wrong conclusions. When a body composition formula or method sys-tematically overestimates the FFM in obese subjects, a “normal” resting metabolic rate in obese subjects would be underestimated after “correction” for dif-ferences in body composition (expressed as kJ/kg FFM). This may lead to the conclusion that obese subjects have lower metabolic rates, which might have caused their excess adipose tissue stores. This argument does not even imply whether the FFM can be treated as one entity in different populations instead of different components such as the heart, liver, or muscles (Gallagher et al., 1998). These con-siderations are important for comparative studies between groups (e.g., obese versus nonobese, elderly versus young or middle-aged), but also for longitudi-nal studies (e.g., weight-loss studies).
The use of bioelectrical impedance to predict changes in FFM, TBW, or body fat during weight loss is questionable. The difference in body water distri-bution (anatomically as well as intracellular/extracel-lular) before and after weight loss may be considerable, leading to a different and systematic bias of the pre-diction equation. In such a study it may be better to report changes in impedance values instead of changes in predicted body composition. Another example is the very low change in impedance after water removal in patients with ascites. Despite the fact that a consid-erable amount of water is removed from the body, the change in total body impedance is low as the trunk hardly contributes to total body impedance.
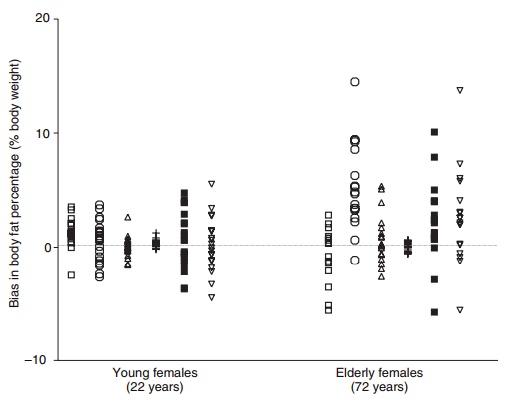
All methods have their limitations, doubly indirect more than indirect methods. Figure 2.7 shows the individual errors in body fat percentage from den-sitometry, DXA, deuterium dilution, a chemical three-compartment model, skinfold thicknesses, and bioelectrical impedance in young and elderly women compared with body fat percentage obtained from a four-compartment model. It is obvious that errors can be considerable, both at a group level and espe-cially at an individual level in the elderly. Many of these errors can be explained by the violation of assumptions. This clearly shows that information on body composition must be used with an awareness of the limitations of the techniques.
Related Topics