Chapter: Object Oriented Analysis and Design
UML state diagrams and modeling
UML state diagrams and modeling
State
diagrams are used to describe the behavior of a system. State diagrams describe
all of the possible states of an object as events occur. Each diagram usually
represents objects of a single class and track the different states of its
objects through the system.
When
to Use: State Diagrams
Use
state diagrams to demonstrate the behavior of an object through many use cases
of the system. Only use state diagrams for classes where it is necessary to
understand the behavior of the object through the entire system. Not all
classes will require a state diagram and state diagrams are not useful for
describing the collaboration of all objects in a use case. State diagrams are
other combined with other diagrams such as interaction diagrams and activity
diagrams.
How
to Draw: State Diagrams
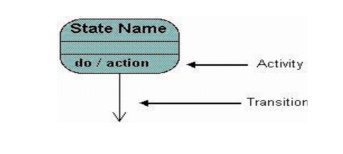
State
diagrams have very few elements. The basic elements are rounded boxes
representing the state of the object and arrows indicting the transition to the
next state. The activity section of the state symbol depicts what activities
the object will be doing while it is in that state.
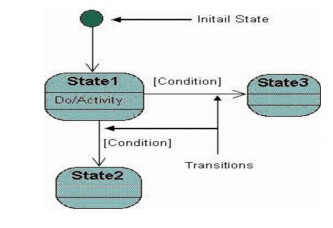
All
state diagrams being with an initial state of the object. This is the state of
the object when it is created. After the initial state the object begins
changing states. Conditions based on the activities can determine what the next
state the object transitions to.
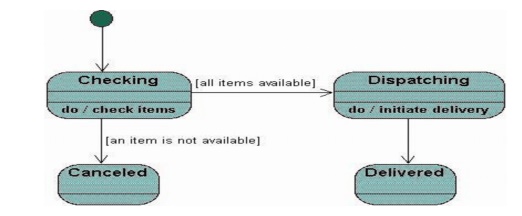
Below
is an example of a state diagram might look like for an Order object. When the
object enters the Checking state it performs the activity "check
items." After the activity is completed the object transitions to the next
state based on the conditions [all items available] or [an item is not
available]. If an item is not available the order is canceled. If all items are
available then the order is dispatched. When the object transitions to the
Dispatching state the activity "initiate delivery" is performed.
After this activity is complete the object transitions again to the Delivered
state.
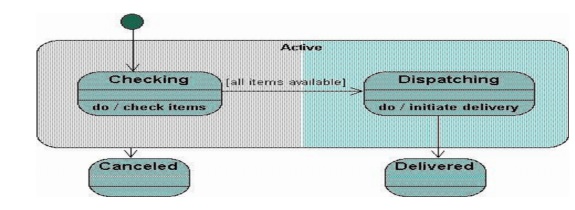
State
diagrams can also show a super-state for the object. A super-state is used when
many transitions lead to the a certain state. Instead of showing all of the
transitions from each state to the redundant state a super-state can be used to
show that all of the states inside of the super-state can transition to the
redundant state.
This
helps make the state diagram easier to read. The diagram below shows a
super-state. Both the Checking and Dispatching states can transition into the
Canceled state, so a transition is shown from a super-state named Active to the
state Cancel.
By
contrast, the state Dispatching can only transition to the Delivered state, so
we show an arrow only from the Dispatching state to the Delivered state.
Activity
Diagrams
Activity
diagrams describe the workflow behavior of a system. Activity diagrams are
similar to state diagrams because activities are the state of doing something.
The diagrams describe the state of activities by showing the sequence of
activities performed. Activity diagrams can show activities that are
conditional or parallel.
When
to Use: Activity Diagrams
Activity
diagrams should be used in conjunction with other modeling techniques such as
interaction diagrams and state diagrams. The main reason to use activity
diagrams is to model the workflow behind the system being designed.
Activity
Diagrams are also useful for: analyzing a use case by describing what actions
need to take place and when they should occur; describing a complicated
sequential algorithm; and modeling applications with parallel processes.
However,
activity diagrams should not take the place of interaction diagrams and state
diagrams. Activity diagrams do not give detail about how objects behave or how
objects collaborate.
How
to Draw: Activity Diagrams
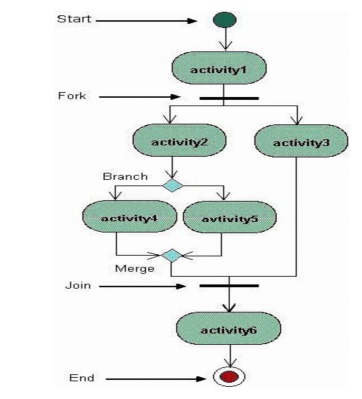
Activity
diagrams show the flow of activities through the system. Diagrams are read from
top to bottom and have branches and forks to describe conditions and parallel
activities. A fork is used when multiple activities are occurring at the same
time.
The
diagram below shows a fork after activity1. This indicates that both activity2
and activity3 are occurring at the same time
After
activity2 there is a branch. The branch describes what activities will take
place based on a set of conditions. All branches at some point are followed by
a merge to indicate the end of the conditional behavior started by that branch.
After
the merge all of the parallel activities must be combined by a join before
transitioning into the final activity state.
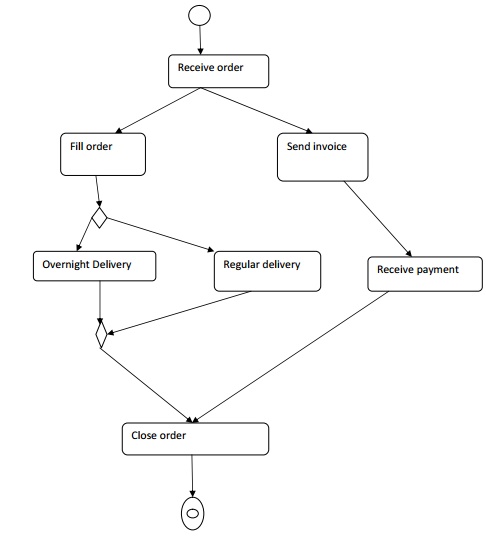
Below
is a possible activity diagram for processing an order. The diagram shows the
flow of actions in the system's workflow. Once the order is received the
activities split into two parallel sets of activities.
One
side fills and sends the order while the other handles the billing. On the Fill
Order side, the method of delivery is decided conditionally.
Depending
on the condition either the Overnight Delivery activity or the Regular Delivery
activity is performed. Finally the parallel activities combine to close the
order
Physical
Diagrams: There are two types of physical diagrams:
deployment diagrams and component diagrams. Deployment diagrams show the
physical relationship between hardware and software in a system. Component
diagrams show the software components of a system and how they are related to
each other. These relationships are called dependencies.
When
to Use: Physical Diagrams
Physical
diagrams are used when development of the system is complete. Physical diagrams
are used to give descriptions of the physical information about a system.
How
to Draw: Physical Diagrams
Many
times the deployment and component diagrams are combined into one physical
diagram. A combined deployment and component diagram combines the features
of both diagrams into
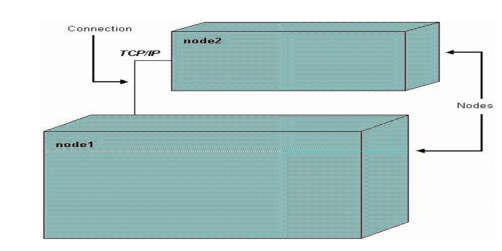
one diagram. The deployment
diagram contains nodes and connections. A node usually represents a
piece of hardware in the system. A connection
depicts the communication
path used by
the hardware to communicate and usually indicates a method
such as TCP/IP.
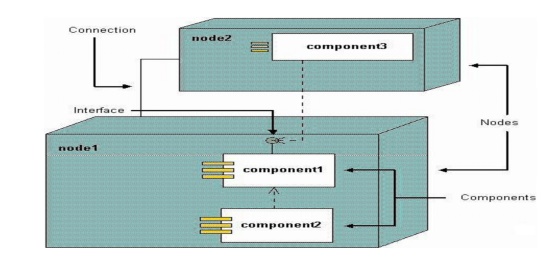
The component
diagram contains components
and dependencies. Components represent the physical packaging of a
module of code. The dependencies between the components show how changes made
to one component may affect the other components in the system.
Dependencies
in a component diagram are represented by a dashed line between two or more
components. Component diagrams can also show the interfaces used by the
components to communicate to each other.
The
combined deployment and component diagram below gives a high level physical
description of the completed system. The diagram shows two nodes which
represent two machines communicating through TCP/IP.
Component2 is dependent on component1, so changes to component 2 could affect component1. The diagram also depicts component3 interfacing with component1. This diagram gives the reader a quick overall view of the entire system.
Related Topics