Procedure Steps, Example Solved Problems | Statistics - Test of Significance for Two Normal Population Variances | 12th Statistics : Chapter 3 : Tests Based on Sampling Distributions II
Chapter: 12th Statistics : Chapter 3 : Tests Based on Sampling Distributions II
Test of Significance for Two Normal Population Variances
TEST OF SIGNIFICANCE FOR TWO NORMAL POPULATION VARIANCES
Test procedure:
This test compares the variances of two independent normal
populations, viz., N(μX, σX2)
and N(μY, σY2).
Step 1 : Null Hypothesis H0 : σX2 =
σY2
That is, there is no significant difference between the variances
of the two normal populations.
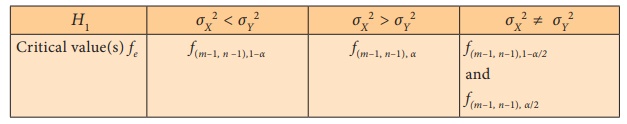
The alternative hypothesis can be chosen suitably from any one of
the following
(i) H1 : σX2 < σY2
(ii) H1 : σX2
> σY2 (iii) H1
: σX2 ≠ σY2
Step 2 : Data
Let X1, X2,. . ., Xm
and Y1, Y2,. . ., Yn be
two independent samples drawn from two normal populations respectively.
Step 3 : Level of significance
α
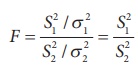
Step 4 : The test Statistic
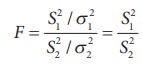 under H0 and its sampling
distribution under H0 is F(m-1, n-1).
under H0 and its sampling
distribution under H0 is F(m-1, n-1).
Step 5 : Calculation of the Test Statistic
The test statistic 
Step 6 : Critical values
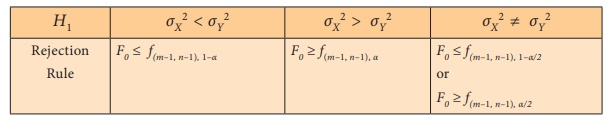
Step 7 : Decision
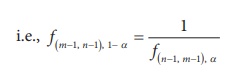
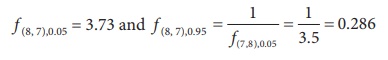
Note 1: Since f(m–1, n–1),1-α is not avilable in the given F-table, it is computed as the reciprocal of f(n–1, m–1),α.
Note 2: A F-test is based on the ratio of variances, it is also known as
Variance Ratio Test.
Note 3: When μX and μY are known, for testing
the equality of variances of two normal populations, the test statistic is
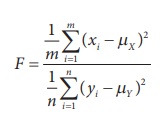 and follows Fm, n-distribution
under H0
and follows Fm, n-distribution
under H0
Example 3.1
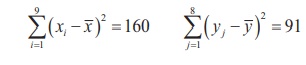
Two samples of sizes 9 and 8 give the sum of squares of deviations
from their respective means as 160 inches square and 91 inches square
respectively. Test the hypothesis that the variances of the two populations
from which the samples are drawn are equal at 10% level of significance.
Solution:
Step 1 : Null Hypothesis: H0 : σX2 =
σY2
That is there is no significant difference between the two
population variances.
Alternative Hypothesis: H1 : σX2 ≠ σY2
That is there is significant difference between the two population
variances.
Step 2 : Data
m = 9, n = 8
Step 3 : Level of significance
α = 10%
Step 4 : Test Statistic
 , under H0.
Step 5 : Calculation
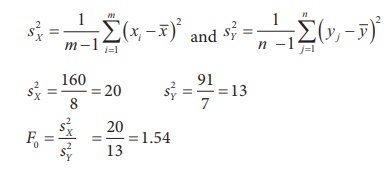
Step 6 : Critical values
Since H1 is a two-sided alternative hypothesis
the corresponding critical values are:
Step 7 : Decision
Since f (8, 7),0.95 = 0.286 < F0
= 1.54 < f (8, 7),0.05 = 3.73, the null hypothesis is not
rejected and we conclude that there is no significant difference between the
two population variances.
Note 4: The critical values of F corresponding to α = 0.05 requires table
values at 0.025 and 0.975 which are not provided. Hence α is taken as 0.1 in this
example.
Example 3.2
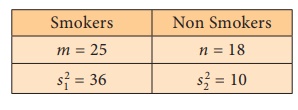
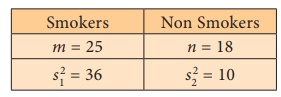
A medical researcher claims that the variance of the heart rates
(in beats per minute) of smokers is greater than the variance of heart rates of
people who do not smoke. Samples from two groups are selected and the data is
given below. Using = 0.05, test whether there is enough evidence to support the
claim.
Solution:
Step 1 : Null Hypothesis: H0 : σ12 =
σ22
That is there is no significant difference between the two
population variances.
H1 : σ12 > σ22
That is, the variance of heart rates of smokers is greater than
that of non-smokers.
Step 2 : Data
Step 3 : Level of significance α = 5%
Step 4 : Test statistic
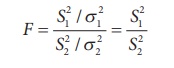
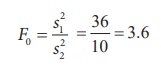
Step 5 : Calculation
Step 6 : Critical value
f (m-1,n-1),0.05 = f (24,17),0.05
= 2.19
Step 7 : Decision
Since F0 = 3.6 > f (24,17),0.05
= 2.19, the null hypothesis is rejected and we conclude that the variance of
heart beats for smokers seems to be considerably higher compared to that of
the non-smokers.
Example 3.3
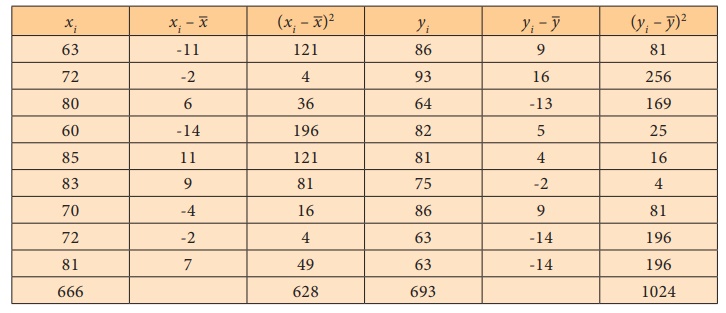
The following table gives the random sample of marks scored by
students in two schools, A and B.

Is the variance of the marks of students in school A is less than
that of those in school B?
Test at 5% level of significance.
Solution:
Let X1, X2 , …, Xm
represent sample values for school A and let Y1, Y2,
…, Yn represent sample values for school B.
Step 1 : Null Hypothesis: H1 : σX2 =
σY2
That is, there is no significant difference between the two
population variances.
Alternative Hypothesis: H1 : σX2 < σY2
That is, the variance of marks in school A is significantly less
than that of school B.
Step 2 : Data
X1, X2,…, Xm are sample from school A
Y1, Y2, ..., Yn are sample from
school B
Step 3 : Test statistic
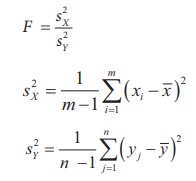
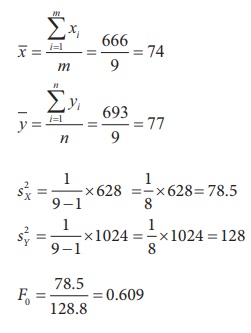
Step 4 : Calculations
Step 5 : Level of significance
= 5%
Step 6 : Critical value
f(9-1,9-1),0.95 = 1/ f( 8
,8),0.05 = 1/3.44 = 0.291
Step 7 : Decision
Since F 0 = 0.609 > f(8,8),0.95
= 0.291, the null hypothesis is not rejected and we conclude that in
school B there seems to be more variance present than in school A.
Related Topics