Procedure Steps, Example Solved Problems | Statistics - Test of Hypotheses for Population Proportion | 12th Statistics : Chapter 1 : Tests of Significance - Basic Concepts and Large Sample Tests
Chapter: 12th Statistics : Chapter 1 : Tests of Significance - Basic Concepts and Large Sample Tests
Test of Hypotheses for Population Proportion
TEST OF HYPOTHESES FOR POPULATION PROPORTION
Procedure:
Step 1 : Let P denote the proportion of the population
possessing the qualitative characteristic (attribute) under study. If p0
is an admissible value of P, then frame the null hypothesis as H0:P
= p0 and choose the suitable alternative hypothesis from
(i) H1: P ≠ p0 (ii) H1:
P > p0 (iii) H1: P < p0
Step 2 : Let p be proportion of the sample
observations possessing the attribute, where n is large,
np > 5 and n(1 – p) > 5.
Step 3 : Specify the level of significance, α.
Step 4 : Consider the test statistic Z  under H0. Here, Q = 1 – P.
The approximate sampling distribution of the test
statistic under H0 is the N(0,1) distribution.
Step 5 : Calculate the value of Z under H0 for the
given data as 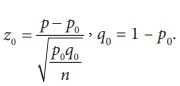
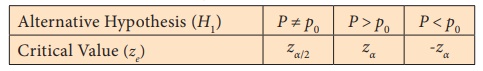
Step 6 : Choose the critical value, ze, corresponding to
α and H1 from the following table
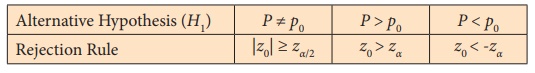
Step 7 : Make decision on H0 choosing the suitable
rejection rule from the following table corresponding to H1.
Example 1.12
A survey was conducted among the citizens of a city to study their
preference towards consumption of tea and coffee. Among 1000 randomly selected
persons, it is found that 560 are tea-drinkers and the remaining are
coffee-drinkers. Can we conclude at 1% level of significance from this
information that both tea and coffee are equally preferred among the citizens
in the city?
Solution:
Step 1 : Let P denote the proportion of people in the
city who preferred to consume tea.
Then, the null and the alternative hypotheses are
Null hypothesis: H 0 : P = 0.5
i.e., it is significant that both tea and coffee are preferred
equally in the city.
Alternative hypothesis: H 1 : P ≠ 0.5
i.e., preference of tea and coffee are not significantly equal. It is
a two-sided alternative hypothesis.
Step 2 : Data
The given sample information are
Sample size (n) = 1000. Hence, it is a large sample.
No. of tea-drinkers = 560
Sample proportion (p) = 560/1000 = 0.56
Step 3 : Level of significance
α= 1%
Step 4 : Test statistic
Since n is large, np = 560 > 5 and n(1 – p)
= 440 > 5, the test statistic under the null hypothesis, is Z =  .
.
Its sampling distribution under H0 is the N(0,1)
distribution.
Step 5 : Calculation of Test Statistic
The value of Z can be calculated for the sample information
from
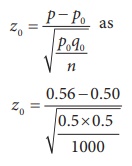
Thus, z0 =
3.79
Step 6 : Critical value
Since H1 is a two-sided alternative hypothesis,
the critical value at 1% level of significance is zα/2
= z0.005 = 2.58.
Step 7 : Decision
Since H1 is a two- sided alternative, elements
of the critical region are determined by the rejection rule |z0|
≥ z e. Thus it is a two-tailed test. Since |z0|
= 3.79 > ze = 2.58, reject H0 at 1%
level of significance. Therefore, there is significant evidence to conclude
that the preference of tea and coffee are different.
Related Topics