Chapter: Introduction to Human Nutrition: Measuring Food Intake
Sources of error in dietary studies
Sources of error in dietary studies
The major sources of error in dietary studies have been reviewed in detail by Bingham (1987). Four possible sources of error occur to some degree with all dietary methods, but can be minimized by careful study design and execution:
● sampling bias
● response bias
● inappropriate coding of foods
● use of food composition tables in place of chemical analysis.
In contrast, the errors that are associated with spe-cific methods are generally much more dependent on the nature of the method and the abilities of the respondents, and therefore less easy to control. Errors of this type include:
●estimation of portion size
●recall or memory error
●day-to-day variation in intake
●effect of survey method on food intake.
Figure 10.6 illustrates the points in the dietary assess-ment process at which different kinds of error operate.
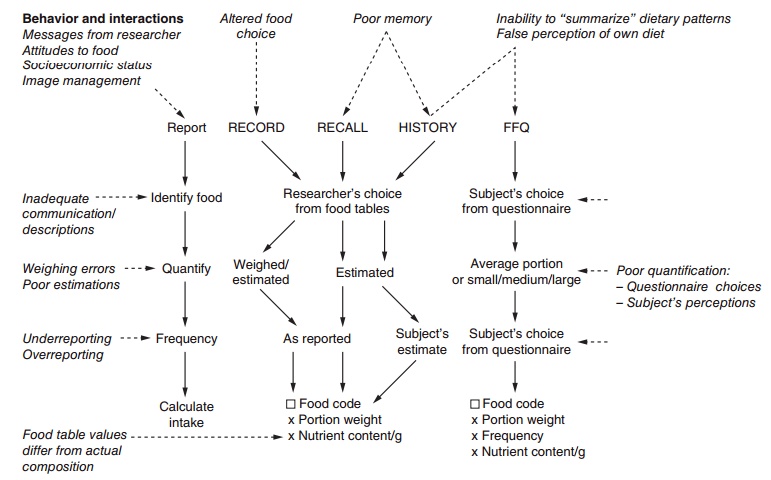
Figure 10.6 The process of dietary assessment showing the different sources of error (shown in italics) and the stages at which they operate in different dietary methods. FFQ, food frequency questionnaire.
Sampling bias
Sampling bias arises when the sample studied is not truly representative of the population of interest. The importance of minimizing sampling bias depends on the purpose of the dietary study. Except in method-ological studies, volunteers are not generally appro-priate respondents because frequently the objective is to study a representative sample of a particular group in order to extrapolate the results to the population group from which the sample was drawn. For this purpose it is clearly important that as many as possi-ble of the sample group originally selected participate in the study.
The proportion of the sample that agrees to par-ticipate in the study can vary considerably even with the same method. It depends not only on the group being studied but also on the circumstances of the study. In general, response rates tend to be greater in studies that use methods such as the 24 hour recall and food frequency questionnaires (which make fewer demands on respondents) and lower in studies such as 7 day weighed records (which require much more cooperation, effort, and time from the respon-dents). It is always important to try to maximize response rates, for example by increasing respondent motivation, providing specific assistance if required, and by allowing respondents as much flexibility as possible in participation within the context of the study objectives.
Response bias
Response bias arises when respondents provide incomplete or inappropriate responses. The extent of this problem is not easy to assess, but can be investi-gated by making measurements that are independent
Measurements suitable for this purpose will be discussed further in the context of validity. Response bias can probably best be minimized by providing the respondents with clear and well-presented instructions, adequate support, and appropriate incentives. Such incentives may include relevant dietary feedback where this is appropriate or monetary or other rewards provided that these are within ethical principles.
In dietary studies that involve more than one inter-viewer, the training of interviewers and the use of standard procedures for interviewing is one way of reducing unnecessary random variation (error) that might otherwise arise because different inter-viewers conduct interviews in different ways. The use of standard procedures, however, can also introduce systematic error; for example, if one interviewer is assigned to interview all respondents in areas of low socioeconomic status and another to interview all respondents in areas of high socioeconomic status. It is important to recognize also that standard interview procedures do not necessarily “standardize” respon-dent response. To date, relatively little work has focused on the respondent response aspect of dietary assessment.
Since all dietary methods engage the cognitive processes of respondents, an appreciation of the properties of human cognition and its limitations is fundamental to improving the accuracy of dietary assessments. Recently, research into the cognitive aspects of dietary assessment has been undertaken in an attempt to increase the understanding of how respondents process dietary intake data (Domel, 1997; Thompson et al., 2002; Vuckovic et al., 2002; Matt et al., 2006).
Some of the important issues in this area that are relevant to improving the quality of dietary data include identification of:
● factors that improve communication between respondent and investigator
● the most effective cues for recall over different periods
● factors that influence retention of dietary informa-tion over time
● the ways in which individuals conceptualize foods and food quantities.
Coding
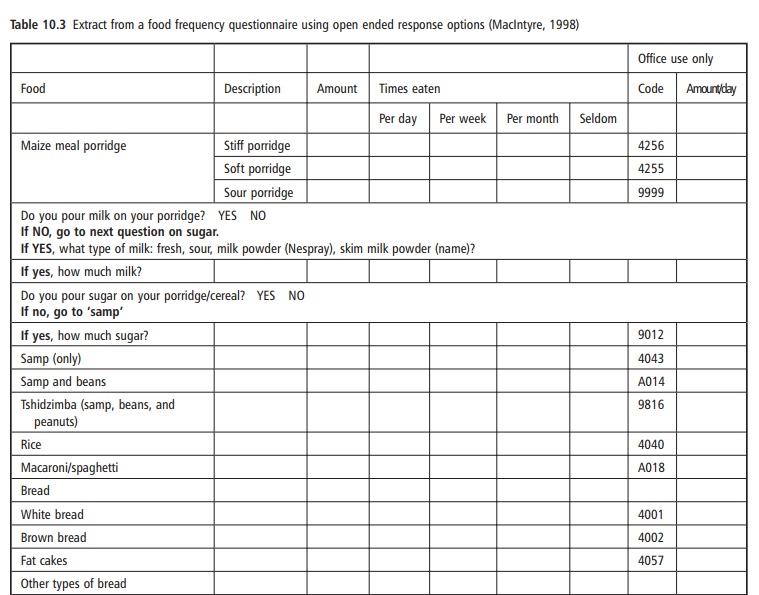
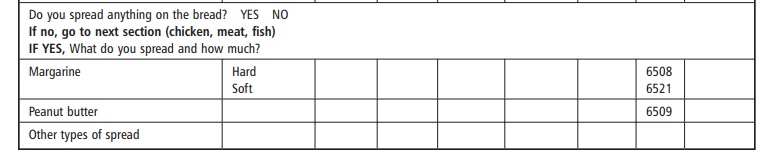
Coding refers to the allocation of a specific code to each food item. Since the nutritional content of a food varies with different processing and preparation methods, it is vital that the correct codes be assigned to each food item. Coding errors arise when the food that has been consumed is not described in suf-ficient detail to enable unambiguous allocation, by the investigator, to a food category in a food composi-tion table or database. Food frequency questionnaires are often precoded to reduce the time needed for coding and the possibility of coding errors (see Table 10.3). Making it easy for respondents to describe foods with the level of detail required is therefore an important consideration in study design. This is increasingly difficult, particularly in industrialized countries where the food supply now consists of thousands of different manufactured foods, the names of which are often no longer a good guide to their nutrient content.
Coding errors are also likely to arise when more than one person is involved in coding and there is no agreed procedure and/or comprehensive coding manual. Coding errors arising exclusively from inadequate description of foods have resulted in coefficients of variation ranging from 3% to 17% for different nutrients. Note that a standard procedure for coding foods, while minimizing differences between coders (random error), can also introduce bias if the coding decisions that are made are not based on up-to-date knowledge of the local food supply and food preparation methods. Gross errors associated with weights of foods can be checked, before analysis, by means of computer routines that identify values outside a prescribed range and by using data-checking techniques such as duplicate data entry.
Use of food composition tables
Most dietary studies use food composition tables or databases rather than chemical analysis to derive the nutrient content of the foods consumed. The purpose of this section is simply to review briefly the kinds of error that can arise as a consequence of using food composition tables to calculate nutrient intake, com-pared with chemical analysis of the diet, and which can lead to both random and systematic errors.
Systematic error can result from:
●the way in which results are calculated or expressed
●the analytical method used
●the processing and preparation methods in common use.
Food composition tables for different countries often use different ways of expressing results and different analytical methods. The ways in which food items are processed or prepared are also likely to differ and for these reasons different sources will not necessarily provide comparable data for the same foods. Systematic differences, which may not necessarily be errors (e.g., when foods are prepared differently in different countries), often only become evident when different food composition tables are used to evaluate the same diets.
Random error arises from the fact that most foods vary in their composition as a result of changes in composition associated with the conditions of pro-duction, processing, storage preparation, and con-sumption. The random error associated with the use of food composition databases generally decreases as the size of the sample group increases. This may not be true, however, in institutional settings where every-one is likely to be consuming food from the same source.
To compare calculated and analyzed data without the complication of other sources of error it is neces-sary that the diets are analyzed by collecting a dupli-cate of what has been eaten at the same time as the diet record. At group level it has been observed that mean intakes calculated from the food tables are gen-erally within approximately 10% of the mean ana-lyzed value for energy and macronutrients, but not for micronutrients. However, a large proportion of individuals have values that fall outside this range.
In general, calculated and analyzed values for nutri-ents agree more closely:
●for groups than for individuals
●for macronutrients than for micronutrients
●when data for locally analyzed foods are used.
Estimation of portion size
Estimation of portion size has long been recognized as an important source of error in dietary studies (Young et al., 1953) with coefficients of variation of the differences between estimates and weights of food portions regularly reported to be around 50% for foods and 20% for nutrients (Nelson and Bingham, 1997). However, despite the fact that individuals are known to vary widely in their ability to estimate portion size, relatively few studies have attempted to quantify the size of this error or to “calibrate” their respondents in this respect.
In attempts to assist respondents to describe portion sizes, a number of visual aids, known as portion size measurement aids (PSMAs), have been developed. These include:
●weighed portions of actual foods
●allowing respondents to serve out portions of food and direct weighing or measuring of the serving
● commercial or home-made food models:
● food pictures or drawings of different portion sizes
● photographs of foods in different portion sizes
● abstract shapes of cardboard, wooden or plastic blocks, wedges, circles, balls, and mounds in various sizes
● household utensils and containers such as cups, spoons, jugs, glasses, bowls, and plates in various sizes
● containers and packets of bought foods, e.g., sweet wrappers, potato crisp packets, cold drink cans and bottles, yoghurt and ice cream cups, milk cartons.
Recall errors
Factors that have been studied in relation to the accu-racy of dietary recall include food consumption patterns, weight status, gender, and age. Many other characteristics, such as intelligence, mood, attention, and salience of the information, however, have also been demonstrated to influence performance tests of general recall, but have not been studied in the context of dietary recall.
Short-term memory
Like the ability to estimate portion size, the ability to remember what was eaten varies with the individual. Studies that have compared the abilities of different groups to remember what they have eaten conclude that women are generally better than men and that younger adults are better than older adults. In short-term recalls of intake (e.g., 24 hour recalls) indivi-duals more often tend to omit an item or items that they have consumed than to include ones that they have not consumed. For this reason, 24 hour recall studies often provide estimates of food intake that are lower than food records obtained over the same period. The size of the error incurred by the omission of one or more food items clearly depends on what is omitted and not only on the proportion of food omitted. For example, the effect, on 24 hour energy intake, of omitting a cup of black coffee, a glass of milk, or a bar of chocolate is quite different.
The omission of food items in 24 hour recall studies can be reduced by appropriate probing by the inter-viewer in relation to meals, between-meal snacks, and other activities on the previous day, but even when respondents have previously weighed their food the average energy intake may still be underestimated by as much as 20%.
Long-term memory
The diet history and most food frequency ques-tionnaires set out to measure the habitual intake of an individual over a period of weeks or months. Individuals are not asked to recall their food intake on specific days, but to construct a picture of their “usual” food consumption pattern over a specified reference period. To provide reliable information individuals thus need to be able to remember the range of foods that they usually consume, to judge the frequency of consumption on a long-term basis, and to be able to estimate correctly the average amount that is usually consumed. These are complex cognitive tasks.
As in the case of 24 hour recalls, no attempt is usually made to assess how well individuals are able to perform these various tasks. From the limited amount of data available from comparative studies between diet histories and long-term diet records, it appears that the two methods do not give concordant results in individuals. Food frequency questionnaires are subject to the same difficulties, and have the added problem that estimates of portion size are based on standard measures or, in the case of mailed question-naires, are made in the absence of visual aids such as food models or photographs.
When respondents are asked to report their intake over a period of weeks they rely largely on generic knowledge of their diet and tend to report items that they are likely to have eaten or items that they rou-tinely eat, rather than items that they specifically remember having eaten during the reference period. This tendency increases with the time interval between the recall and the reference period. The accuracy of frequency estimates also deteriorates with time. While individuals appear to report more frequently eaten foods with greater frequency than less frequently eaten foods, there are differences between individuals in the way that they report the same frequency of consump-tion. Ranking of individuals on the basis of the usual frequency of intake is thus likely to lead to misclassifi-cation unless the extent of the differences between individuals is known and can be taken into account. It is difficult to see how such misclassification can be reduced unless it is possible to classify individuals, in some way, in terms of their ability to provide reliable information on habitual long-term intake.
Day-to-day variation in intake
We have already seen that individuals vary consider-ably in their intake of nutrients from day to day (see Figure 10.2). In addition, the extent of day-to-day variation differs between nutrients. The implication of the first observation is that short-term intake data (e.g., 24 hour recall data) are unlikely to provide a reliable estimate of habitual intake for most individu-als. The implication of the second observation is that the length of time for which dietary data need to be collected, in order to estimate habitual intake with any given level of confidence, varies with the nutrient of interest.
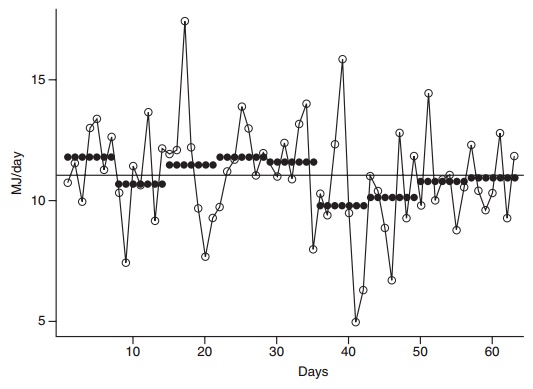
Figure 10.2 Energy intake of one indi-vidual from weighed records obtained for 1 day every sixth day over 1 year. —, overall mean;
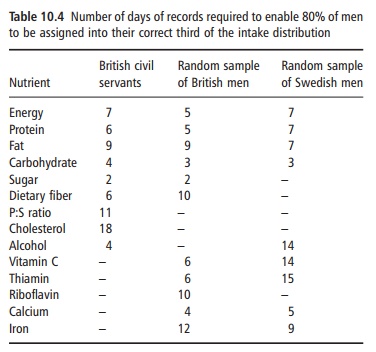
Table 10.4 expresses the impact of this variation in terms of the number of days of dietary information needed to classify 80% of individuals into the correct third of the distribution. It is clear from this table that not only 24 hour recalls but also 7 day records are likely to be inadequate to classify 80% of individuals correctly into the appropriate third of the distribution for most micronutrients. This is an important reason, although not the only reason, why short-term records are only rarely used for epidemiological studies, in preference to food frequency questionnaires, despite the loss of detail and precision inevitably associated with the use of the latter.
Effect on usual diet
Recall methods clearly cannot change what has already been eaten, but what has been eaten can be misre-ported either consciously or unconsciously. When individuals are asked to keep records, however, they may also alter their normal habits as a consequence of the recording process. One obvious reason for
Other reasons may include a desire to eat less in order to lose weight or to be seen to conform with dietary recommendations. If this is what happens in practice, then what is measured in short-term dietary records may be actual intake or desired intake, but not usual intake.
Many studies have now demonstrated that there is a tendency, in most population subgroups, for short-term dietary records to provide estimates of energy intake that are on average around 16% lower than would be expected on the basis of measured and/or estimated levels of energy expenditure.
These studies will be discussed further in the section on precision and validity. The fact that for some groups measurements of energy intake and energy expenditure agree quite closely indicates that it is possible to achieve recording without a concomi-tant change in diet when there is full cooperation from respondents, and highlights the importance of efforts to achieve such cooperation.
Related Topics