Chapter: Mechanical : Total Quality Management (TQM) : TQM Tools & Techniques
Seven tools of quality
SEVEN
TOOLS OF QUALITY
Prerequisite
Discussion
·
The quality of a product or service depends on the
quality of process employed.
·
Every organization needs to establish a set of
well-defined process for manufacturing of product (or) design or service.
·
The objective of process control is to control the
quality of the processes and ensure that the deliverables are produced as
planned.
·
Aim of the statistical based process control is to
produce products and services with quality consistently.
·
Seven quality control tools are very important for
continuous improvement in the TQM journey.
·
It is a prerequisite for ISO 9000 certification
process flow charts are insisted and the organizations are asked to document
the processes.
Concept
There are many proposed tools and techniques to achieve the
TQM promises. Generally, a technique can be considered as a number of
activities performed in a certain order to reach the values .
On the other hand, tools sometimes have statistical basis to
support decision making or facilitate analysis of data.
The best tools for this purpose is check sheet, Pareto chart,
histogram, scatter diagram, run chart and statistical process control (SPC).
The data collected by these tools can be used to measure the
process. The correct selection and use of tools and techniques is a vital
component of any successful TQM implementation plan.
The TQM tools and techniques can be divided into simple tools
for solving a special problem and complex one that cover all functions within
the company.
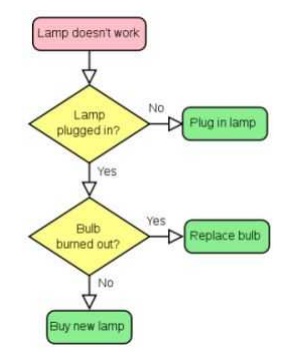
Flow
Charts
This is
one of the basic quality tool that can be used for analyzing a sequence of
events.
The tool maps out a sequence of events that take place
sequentially or in parallel. The flow chart can be used to understand a complex
process in order to find the relationships and dependencies between events.
You can also get a brief idea about the critical path of the
process and the events involved in the critical path.
Flow
charts can be used for any field and to illustrate events involving processes
of any complexity. There are specific software tools developed for drawing flow
charts, such as MS Vision.
You will
be able to freely download some of the open source flow chart tools developed
by the open source community.
Applications:
In a product assembly how sub assemblies made and then build
into final product.
The time taken for before improvement is greater than after
improvement by using flow diagrams.
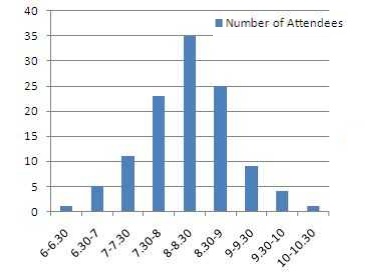
Histogram
Histogram is used for
illustrating the frequency and the extent in the context of two variables.
Histogram is a chart with columns. This represents the distribution by mean. If
the histogram is normal, the graph takes the shape of a bell curve.
If it is not normal, it may take
different shapes based on the condition of the distribution. Histogram can be
used to measure something against another thing. Always, it should be two
variables.
Consider
the following example: The following histogram shows morning attendance of a
class. The X-axis is the number of students and the Y-axis the time of the day.
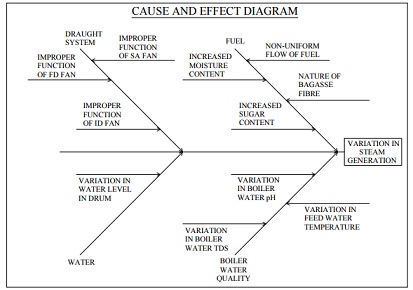
Cause and
Effect Diagram
Cause and effect diagrams
(Ishikawa Diagram) are used for understanding organizational or business problem
causes.
Organizations face problems
everyday and it is required to understand the causes of these problems in order
to solve them effectively. Cause and effect diagrams exercise is usually a
teamwork.
A
brainstorming session is required in order to come up with an effective cause
and effect diagram. All the main components of a problem area are listed and
possible causes from each area is listed. Then, most likely causes of the
problems are identified to carry out further analysis.

Check
Sheet
A check sheet can be introduced as the most basic tool for
quality. A check sheet is basically used for gathering and organizing data.
When this is done with the help of software packages such as
Microsoft Excel, you can derive further analysis graphs and automate through
macros available.
Therefore, it is always a good idea to use a software check
sheet for information gathering and organizing needs.
One can always use a paper-based check sheet when the
information gathered is only used for backup or storing purposes other than
further processing.
Types of
check sheet
1.
Process distribution check sheets.
2.
Defective item check sheets.
3.
Defect location check sheet.
4.
Defect factor check sheet.
Scatter Diagram
When it comes to the values of
two variables, scatter diagrams are the best way to present. Scatter diagrams
present the relationship between two variables and illustrate the results on a
Cartesian plane. Then, further analysis, such as trend analysis can be performed
on the values.
In these diagrams, one variable
denotes one axis and another variable denotes the other axis.
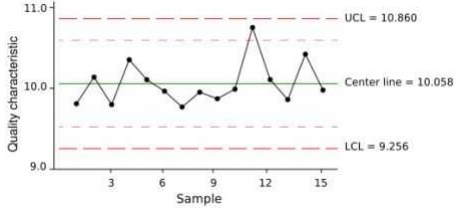
Control
Charts
Control chart is the best tool for monitoring the performance
of a process. These types of charts can be used for monitoring any processes
related to function of the organization.
These charts allow you to identify the following conditions
related to the process that has been monitored.
·
Stability of the process
·
Predictability of the process
·
Identification of common cause of variation
·
Special conditions where the monitoring party
needs to react
·
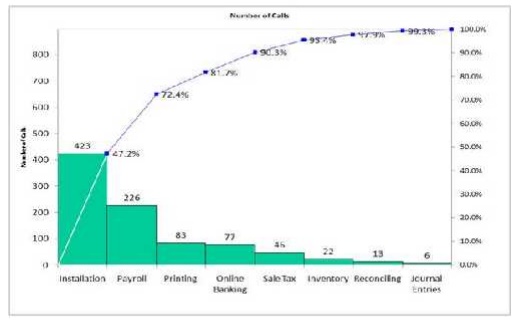
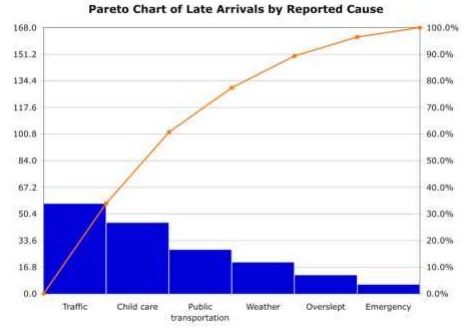
Pareto
Charts
Pareto charts are used for identifying a set of priorities.
You can chart any number of issues/variables related to a specific concern and
record the number of occurrences.
This way you can figure out the
parameters that have the highest impact on the specific concern. This helps you
to work on the propriety issues in order to get the condition under control.
SIGNIFICANCE:
Above
seven basic quality tools help you to address different concerns in an
organization.
Therefore, use of such tools should be a basic practice in the
organization in order to enhance the efficiency.
Trainings on these tools should be included in the
organizational orientation program, so all the staff members get to learn these
basic tools.
Most of the organizations use quality tools for various
purposes related to controlling and assuring quality.
Although there are a good number of quality tools specific to
certain domains, fields and practices, some of the quality tools can be used
across such domains. These quality tools are quite generic and can be applied
to any condition.
There are seven basic quality tools used in organizations. These
tools can provide much information about problems in the organization assisting
to derive solutions for the same.
A number of these quality tools come with a price tag. A brief
training, mostly a self-training, is sufficient for someone to start using the
tools.
Let's
have a look at the seven basic quality tools in brief.
Related Topics