Mathematics - Representation of Functions | 10th Mathematics : UNIT 1 : Relation and Function
Chapter: 10th Mathematics : UNIT 1 : Relation and Function
Representation of Functions
Representation of Functions
A function may be
represented by
(a) a set of
ordered pairs
(b) a table form
(c) an arrow diagram
(d) a graphical form
Let f: A→
B be a function
(a) Set of ordered pairs
The set f= {(x,y)
| y = f (x), x ∈ A} of all ordered pairs represent a function.
(b) Table form
The values of x and
the values of their respective images under f can be given in the form
of a table
(c) Arrow diagram
An arrow diagram indicates the elements
of the domain of f and their respective images by means of arrows
(d) Graph
The ordered pairs in
the collectionf= {(x,y)| y = f (x), x
∈ A} are plotted as points in the xy- plane. The graph of f is the
totality of all such points’
Every function can be
represented by a curve in a graph. But not every curve drawn in a graph will
represent a function.
The following test
will help us in determining whether a given curve is a function or not.
Vertical line test
“A curve drawn in a
graph represents a function, if every vertical line intersects the curve in at most one point.”
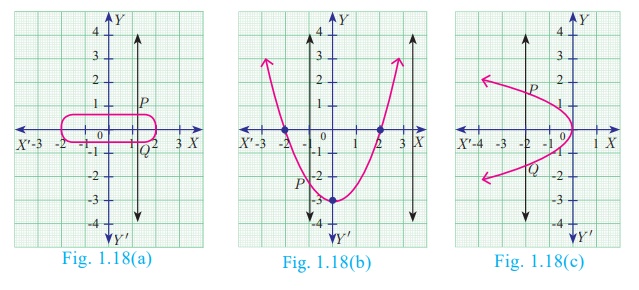
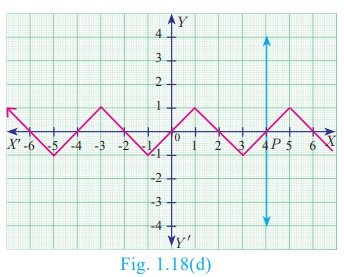
Example 1.10
Using vertical line
test, determine which of the following curves (Fig.1.18(a), 1.18(b), 1.18(c),
1.18(d)) represent a function?

Solution
The curves in
Fig.1.18(a) and
Fig.1.18(c) do not represent a function as
the vertical lines meet the curves in two points P and Q.
The curves in
Fig.1.18(b) and Fig.1.18(d) represent a function as the vertical lines meet the
curve in at most one point.

Notes
Any equation
represented in a graph is usually called a ‘curve’.
Example 1.11 Let A =
{1, 2, 3, 4} and B = {2, 5, 8,11,14}be two sets. Let f: A→
B be a function given by f (x) = 3x − 1 . Represent
this function
(i) by arrow diagram
(ii) in a table form
(iii) as a set of
ordered pairs
(iv) in a graphical
form
Solution
A = {1, 2, 3, 4} ; B =
{2, 5, 8,11,14} ; f (x) = 3x – 1
f (1) = 3(1) – 1 = 3 – 1
= 2 ; f (2) = 3(2) – 1 = 6 – 1 = 5
f (3) = 3(3) – 1 = 9 – 1
= 8 ; f (4) = 4(3) – 1 = 12 – 1 = 11
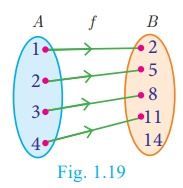
(i) Arrow diagram
Let us represent the function : A → B by an
arrow diagram (Fig.1.19).

(ii) Table form
The given function f
can be represented in a tabular form as given below

(iii) Set of ordered pairs
The function f
can be represented as a set of ordered pairs as
f = {(1,2),(2,5),(3,8),(4,11)}
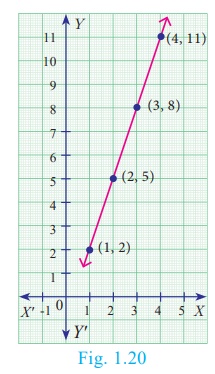
(iv) Graphical form
In the adjacent xy -plane
the points
(1,2), (2,5), (3,8),
(4,11) are plotted (Fig.1.20).

Related Topics