Chapter: Medical Physiology: Heart Muscle; The Heart as a Pump and Function of the Heart Valves
Relationship of the Electrocardiogram to the Cardiac Cycle
Relationship of the Electrocardiogram to the Cardiac Cycle
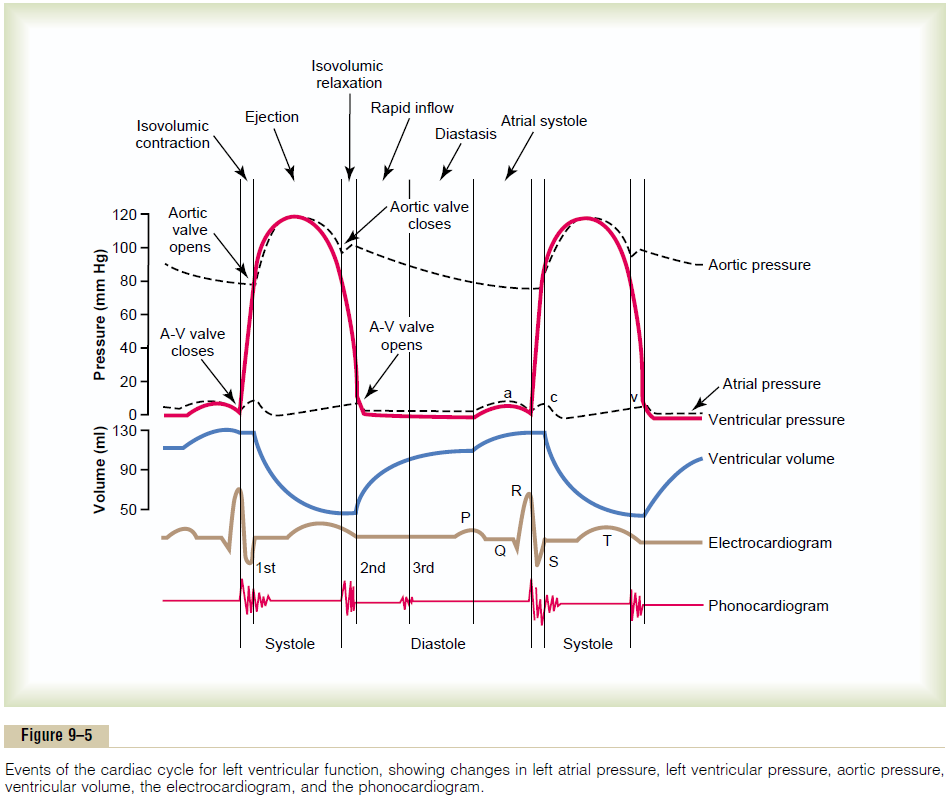
The electrocardiogram in Figure 9–5 shows the P, Q,R, S, and T waves. They are electrical voltages generated by the heart and recorded by the electrocardiograph from the surface of the body.
The P wave is caused by spread of depolarization through the atria, and this is followed by atrial con-traction, which causes a slight rise in the atrial pres-sure curve immediately after the electrocardiographic P wave.
About 0.16 second after the onset of the P wave, the QRS waves appear as a result of electrical depolariza-tion of the ventricles, which initiates contraction of the ventricles and causes the ventricular pressure to begin rising, as also shown in the figure. Therefore, the QRS complex begins slightly before the onset of ventricu-lar systole.
Finally, one observes the ventricular T wave in the electrocardiogram. This represents the stage of repo-larization of the ventricles when the ventricular muscle fibers begin to relax. Therefore, the T wave occurs slightly before the end of ventricular contraction.
Related Topics