Chapter: Power Quality : Power Quality Monitoring
Power Quality Measurement Equipment
POWER QUALITY MEASUREMENT
EQUIPMENT
They
include everything from very fast transient over voltages (microsecond time
frame) to long-duration outages (hours or days time frame). Power quality
problems also include steady-state phenomena, such as harmonic distortion, and
intermittent phenomena, such as voltage flicker.
1. Types of instruments
Although
instruments have been developed that measure a wide variety of disturbances, a
number of different instruments may be used, depending on the phenomena being
investigated. Basic categories of instruments that may be applicable include
■ Wiring
and grounding test devices
■ Multimeters
■ Oscilloscopes
■ Disturbance
analyzers
■ Harmonic
analyzers and spectrum analyzers
■ Combination
disturbance and harmonic analyzers
■ Flicker
meters
■ Energy
monitors
Besides
these instruments, which measure steady-state signals or disturbances on the
power system directly, there are other instruments that can be used to help
solve power quality problems by measuring ambient conditions:
1.
Infrared meters can be very valuable in detecting
loose connection sand overheating conductors. An annual procedure of checking
the system in this manner can help prevent power quality problems due to
arcing, bad connections, and overloaded conductors.
2. Noise
problems related to electromagnetic radiation may require measurement of field
strengths in the vicinity of affected equipment. Magnetic gauss meters are used
to measure magnetic field strengths for inductive coupling concerns. Electric
field meters can measuret he strength of electric fields for electrostatic
coupling concerns.
3. Static
electricity meters are special-purpose devices used to measure static
electricity in the vicinity of sensitive equipment. Electrostatic discharge
(ESD) can be an important cause of power quality problems in some types of
electronic equipment.
Regardless
of the type of instrumentation needed for a particular test, there are a number
of important factors that should be considered when selecting the instrument.
Some of the more important factors include
Ø Number of
channels (voltage and/or current)
Ø Temperature
specifications of the instrument
Ø Ruggedness
of the instrument
Ø Input
voltage range (e.g., 0 to 600 V)
Ø Power
requirements
Ø Ability
to measure three-phase voltages
Ø Input
isolation (isolation between input channels and from each input to ground)
Ø Ability
to measure currents
Ø Housing
of the instrument (portable, rack-mount, etc.)
Ø Ease of
use (user interface, graphics capability, etc.)
Ø Documentation
Ø Communication
capability (modem, network interface)
Ø Analysis
software
The
flexibility (comprehensiveness) of the instrument is also important. The more
functions that can be performed with a single instrument, the fewer the number
of instruments required
Wiring and grounding testers:
Many
power quality problems reported by end users are caused by problems with wiring
and/or grounding within the facility. These problems can be identified by
visual inspection of wiring, connections, and panel boxes and also with special
test devices for detecting wiring and grounding problems.
Important
capabilities for a wiring and grounding test device include
Ø Detection
of isolated ground shorts and neutral-ground bonds
Ø Ground
impedance and neutral impedance measurement or indication
Ø Detection
of open grounds, open neutrals, or open hot wires
Ø Detection
of hot/neutral reversals or neutral/ground reversals
Three-phase
wiring testers should also test for phase rotation and phase-to-phase voltages.
These test devices can be quite simple and provide an excellent initial test
for circuit integrity. Many problems canbe detected without the requirement for
detailed monitoring using expensive instrumentation.
Multimeters:
After
initial tests of wiring integrity, it may also be necessary to make quick
checks of the voltage and/or current levels within a facility. Overloading of
circuits, under voltage and overvoltage problems, and unbalances between
circuits can be detected in this manner. These measurements just require a
simple multi meter. Signals used to check for these include
Ø Phase-to-ground
voltages
Ø Phase-to-neutral
voltages
Ø Neutral-to-ground
voltages
Ø Phase-to-phase
voltages (three-phase system)
Ø Phase
currents
Ø Neutral
currents
The most
important factor to consider when selecting and using a multimeter is the
method of calculation used in the meter. All the commonly used meters are
calibrated to give an rms indication for the measured signal. However, a number
of different methods are used to
calculate
the rms value. The three most common methods are
1. Peak method. Assuming the signal to be a
sinusoid, the meter reads the peak of the signal and divides the result by 1.414 (square root of 2) to obtain the rms.
2. Averaging method. The meter determines the average value of a
rectified signal. For a clean sinusoidal
signal (signal containing only one frequency), this average value is related to
the rms value by a constant.
3. True rms. The rms value of a signal is a
measure of the heating that will result if the voltage is impressed across a resistive load. One method of detecting the
true rms value is to actually use a thermal detector to measure a heating
value. More modern digital meters use a digital calculation of the rms value by
squaring the signal on a sample by-sample basis, averaging over the period, and
then taking the square root of the result. These different methods all give the
same result for a clean, sinusoidal signal but can give significantly different
answers for distorted signals. This is very important because significant
distortion levels are
2. Disturbance analyzers
Disturbance
analyzers and disturbance monitors form a category of instruments that have
been developed specifically for power quality measurements. They typically can
measure a wide variety of system disturbances from very short duration
transient voltages to long-duration outages or under voltages. Thresholds can
be set and the instruments left unattended to record disturbances over a period
of time. The information is most commonly recorded on a paper tape, but many
devices have attachments so that it can be recorded on disk as well.
There are
basically two categories of these devices:
1. Conventional analyzers that summarize events
with specific information such as overvoltage and undervoltage magnitudes, sags
and surge magnitude and duration, transient magnitude and duration, etc.
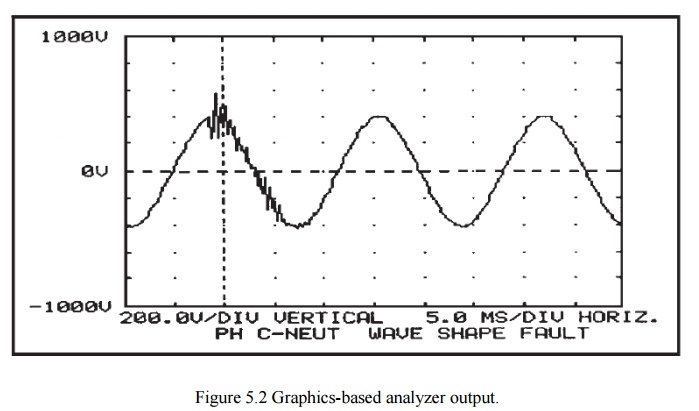
2. Graphics-based analyzers that save and print the
actual waveform along with the descriptive information which would be generated
by one of the conventional analyzers
It is
often difficult to determine the characteristics of a disturbance or a
transient from the summary information available from conventional disturbance
analyzers. For instance, an oscillatory transient cannot be effectively
described by a peak and a duration. Therefore, it is almost imperative to have
the waveform capture capability of a graphics-based disturbance analyzer for
detailed analysis of a power quality problem (Fig. 5.2). However, a simple conventional
disturbance monitor can be valuable for initial checks at a problem location.
3. Spectrum analyzers and
harmonic analyzers
Harmonic
analyzers have several capabilities. They capture harmonic waveforms and
display them on a screen. They calculate the K factor to de rate transformers
and the total harmonic distortion (THD) in percent of the fundamental. They
also measure the corresponding frequency
spectrum, i.e., the harmonic frequency associated with the current and voltage
up to the fiftieth harmonic.
They
display the harmonic frequency on a bar graph or as the signal’s numerical
values.
Some
measure single-phase current and voltage while others measure three-phase
current and voltage. All of them measure the power factor (PF). The power
factor provides a measurement of how much of the power is being used
efficiently for useful work. Some can store data for a week or more for later
transfer to a PC for analysis.
This
makes them powerful tools in the analysis of harmonic power quality problems.
Some of the more powerful analyzers have add-on modules that can be used for
computing fast Fourier transform (FFT) calculations to determine the
lower-order harmonics. However, any significant harmonic measurement
requirements will demand an instrument that is designed for spectral analysis
or harmonic analysis. Important capabilities for useful harmonic measurements
include Capability to measure both voltage and current simultaneously so that
harmonic power flow information can be obtained.
■
Capability to measure both magnitude and phase angle of individual harmonic
components (also needed for power flow calculations).
■ Synchronization and a sampling rate fast enough
to obtain accurate measurement of harmonic components up to at least the 37th
harmonic (this requirement is a combination of a high sampling rate and a
sampling interval based on the 60-Hz fundamental).
■ Capability to characterize the statistical nature
of harmonic distortion levels (harmonics levels change with changing load
conditions and changing system conditions).
There are basically three categories of instruments
to consider for harmonic analysis:
1. Simple meters. It may sometimes be necessary
to make a quick check of harmonic levels
at a problem location. A simple, portable meter for this purpose is ideal.
There are now several hand-held instruments of this type on the market. Each
instrument has advantages and disadvantages in its operation and design. These
devices generally use microprocessor-based circuitry to perform the necessary
calculations to determine individual harmonics up to the 50th harmonic, as well
as the rms, the THD, and the telephone influence factor (TIF). Some of these
devices can calculate harmonic powers (magnitudes and angles) and can upload
stored waveforms and calculated data to a personal computer.
2. General-purpose spectrum analyzers.
Instruments in this category are designed to perform spectrum analysis on waveforms for a wide variety of
applications. They are general signal analysis instruments. The advantage of
these instruments is that they have very powerful capabilities for a reasonable
price since they are designed for a broader market than just power system
applications. The disadvantage is that they are not designed specifically for
sampling power frequency waveforms and, therefore, must be used carefully to
assure accurate harmonic analysis. There are a wide variety of instruments in
this category.
3. Special-purpose power system harmonic analyzers. Besides
the general-purpose spectrum
analyzers just described, there are also a number of instruments and devices
that have been designed specifically for power system harmonic analysis. These
are based on the FFT with sampling rates specifically designed for determining
harmonic components in power signals. They can generally be left in the field
and include communications capability for remote monitoring.
4. Flicker meters
Over the
years, many different methods for measuring flicker have been developed. These
methods range from using very simple rms meters with flicker curves to
elaborate flicker meters that use exactly tuned filters and statistical
analysis to evaluate the level of voltage flicker. This section discusses
various methods available for measuring flicker.
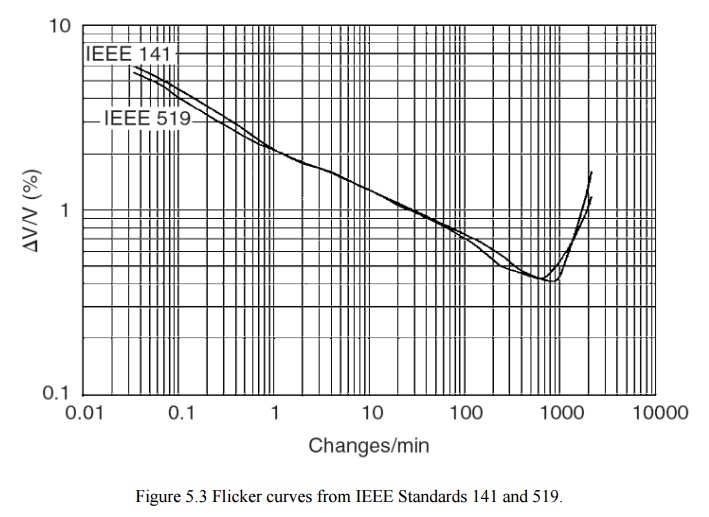
Flicker standards. Although
the United States does not currently have a standard for flicker measurement, there are IEEE standards
that address flicker. IEEE Standards 141-19936 and 519-19927 both contain
flicker curves that have been used as guides for utilities to evaluate the
severity of flicker within their system. Both flicker curves, from Standards
141 and 519, are shown in Fig. 5.3. In other countries, a standard methodology
for measuring flicker has been established. The IEC flicker meter is the
standard for measuring flicker in Europe and other countries currently adopting
IEC standards. The IEC method for flicker measurement, defined in IEC Standard
61000-4-158 (formerly IEC 868), is a very comprehensive approach to flicker
measurement and is further described in “Flicker Measurement Techniques” below.
More recently, the IEEE has been working toward adoption of the IEC flicker
monitoring standards with an additional curve to account for the differences
between 230-V and 120-V systems.
Flicker measurement techniques
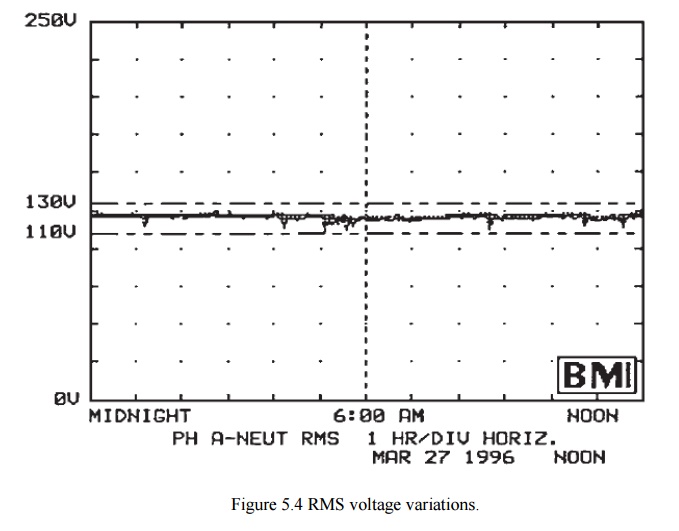
RMS strip charts. Historically,
flicker has been measured using rms meters, load duty cycle, and a flicker curve. If sudden rms
voltage deviations occurred with specified frequencies exceeding values found
in flicker curves, such as one shown in Fig. 5.3, the system was said to have
experienced flicker. A sample graph of rms voltage variations is shown in Fig.
5.4 where large voltage deviations up to 9.0 V rms (_V/V _ ± 8.0 percent on a
120-V base) are found. Upon comparing this to the flicker curve in Fig. 5.3,
the feeder would be experiencing flicker, regardless of the duty cycle of the
load producing the flicker, because any sudden total change in voltage greater
than 7.0 V rms results in objectionable flicker, regardless of the frequency.
The advantage to such a method is that it is quite simple in nature and the rms
data required are rather easy to acquire. The apparent disadvantage to such a
method would be the lack of accuracy and inability to obtain the exact
frequency content of the flicker.
Fast Fourier transforms. Another
method that has been used to measure flicker is to take raw samples of the actual voltage waveforms and implement a fast
Fourier transform on the demodulated signal (flicker signal only) to extract
the various frequencies and magnitudes found in the data. These data would then
be compared to a flicker curve. Although similar to using the rms strip charts,
this method more accurately quantifies the data measured due to the magnitude
and frequency of the flicker being known. The downside to implementing this
method is associated with quantifying flicker levels when the flicker-producing
load contains multiple flicker signals. Some instruments compensate for this by
reporting only the dominant frequency and discarding the rest.
Flicker meters. Because of the complexity of
quantifying flicker levels that are based upon human perception, the most comprehensive approach to measuring
flicker is to use flicker meters. A flicker meter is essentially a device that
demodulates the flicker signal, weights it according to established “flicker
curves,” and performs statistical analysis on the processed data.
Generally,
these meters can be divided up into three sections. In the first section the
input waveform is demodulated, thus removing the carrier signal. As a result of
the demodulator, a dc offset and higher-frequency terms (sidebands) are
produced. The second section removes these unwanted terms using filters, thus
leaving only the modulating (flicker) signal remaining. The second section also
consists of filters that weight the modulating signal according to the
particular meter specifications. The last section usually consists of a
statistical analysis of the measured flicker.
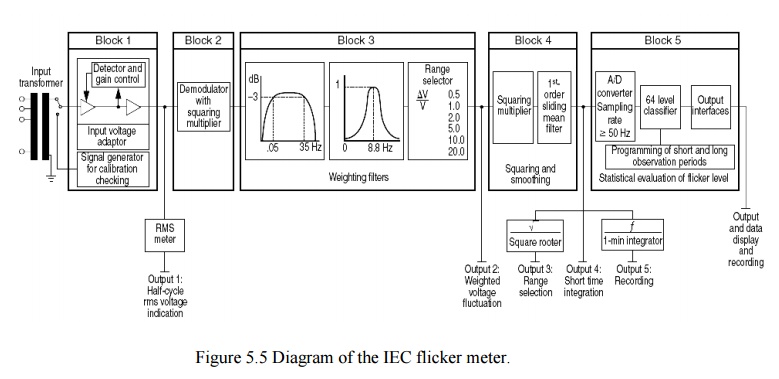
The most
established method for doing this is described in IEC Standard 61000-4-15.8 The
IEC flicker meter consists of five blocks, which are shown in Fig. 5.5.
Block 1
is an input voltage adapter that scales the input half-cycle rms value to an
internal reference level. This allows flicker measurements to be made based
upon a percent ratio rather than be dependent upon the input carrier voltage
level.
Block 2
is simply a squaring demodulator that squares the input to separate the voltage
fluctuation (modulating signal) from the main voltage signal (carrier signal),
thus simulating the behavior of the incandescent lamp.
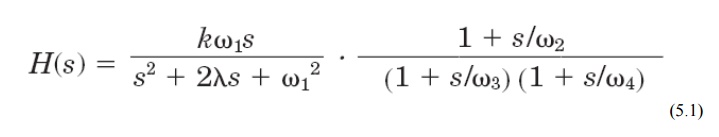
Block 3
consists of multiple filters that serve to filter out unwanted frequencies
produced from the demodulator and also to weight the input signal according to
the incandescent lamp eye-brain response. The basic transfer function for the
weighting filter is
Block 4
consists of a squaring multiplier and sliding mean filter. The voltage signal
is squared to simulate the nonlinear eye-brain response, while the sliding mean
filter averages the signal to simulate the short-term storage effect of the
brain. The output of this block is considered to be the instantaneous flicker
level. A level of 1 on the output of this block corresponds to perceptible
flicker.
Block 5
consists of a statistical analysis of the instantaneous flicker level. The
output of block 4 is divided into suitable classes, thus creating a histogram.
A probability density function is created based upon each class, and from this
a cumulative distribution function can be formed.
Flicker
level evaluation can be divided into two categories, short term and long-term.
Short-term evaluation of flicker severity PST is based upon an observation
period of 10 min. This period is based upon assessing disturbances with a short
duty cycle or those that produce continuous fluctuations. PST can be found
using the equation
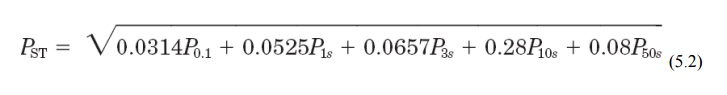
where the
percentages P0.1, P1s, P3s, P10s, and P50s are the flicker levels that are
exceeded 0.1, 1.0, 3.0, 10.0, and 50.0 percent of the time, respectively. These
values are taken from the cumulative distribution curve discussed previously. A
PST of 1.0 on the output of block 5 represents the objectionable (or irritable)
limit of flicker.
For cases
where the duty cycle is long or variable, such as in arc furnaces, or
disturbances on the system that are caused by multiple loads operating
simultaneously, the need for the long-term assessment of flicker severity
arises. Therefore, the long-term flicker severity PLT is derived from PST using
the equation
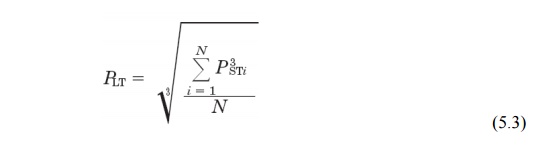
where N
is the number of PST readings and is determined by the duty cycle of the
flicker-producing load. The purpose is to capture one duty cycle of the
fluctuating load. If the duty cycle is unknown, the recommended number of PST
readings is 12 (2-h measurement window). The advantage of using a single
quantity, like Pst, to characterize flicker is that it provides a basis for
implementing contracts and describing flicker levels in a much simpler manner.
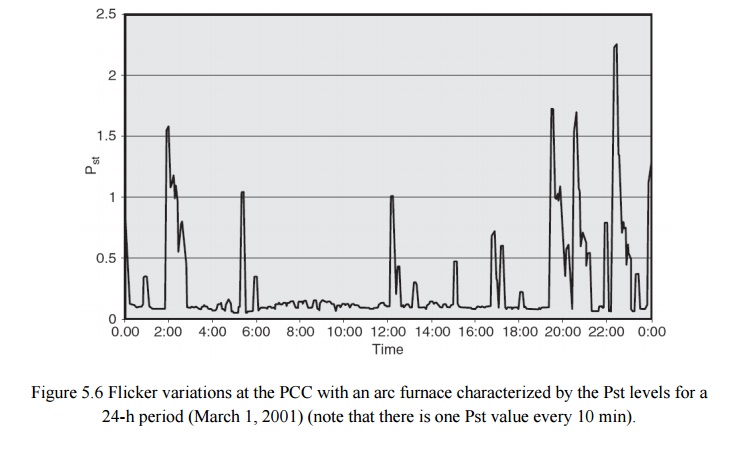
Figure 11.19 illustrates the Pst levels measured at the PCC with an arc furnace
over a 24-h period. The melt cycles when the furnace was operating can be
clearly identified by the high Pst levels. Note that Pst levels greater than
1.0 are usually considered to be levels that might result in customers being
aware of lights flickering.
Related Topics