Chapter: Electrical machines : Synchronous Motors
Phasor Diagram - Synchronous Motors
Phasor Diagram
Fig: 2.24
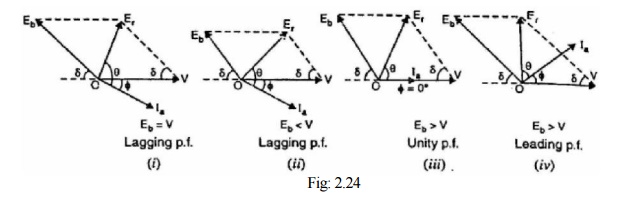
shows the phasor diagrams for different field excitations at constant load.
Fig: 2.24 (i) shows the phasor diagram for normal excitation (Eb = V), whereas
Fig: 2.24 (ii) shows the phasor diagram for under-excitation. In both cases,
the motor has lagging power factor. Fig: 2.24 (iii) shows the phasor diagram
when field excitation is adjusted for unity p.f. operation. Under this
condition, the resultant voltage Er and, therefore, the stator current Ia are
minimum. When the motor is overexcited, it has leading power factor as shown in
Fig: 2.24 (iv). The following points may be remembered:
(i)
For a given load, the power factor is governed by
the field excitation; a weak field produces the lagging armature current and a
strong field produces a leading armature current.
(ii)
The armature current (Ia) is minimum at unity p.f
and increases as the p.f. becomes less either leading or lagging
Related Topics