Chapter: Data Warehousing and Data Mining : Clustering and Applications and Trends in Data Mining
Outlier Analysis
OUTLIER ANALYSIS
The set of objects are considerably dissimilar from the remainder of the
data o Example:
Sports: Michael Jordon, Wayne Gretzky, ...
Problem: Define and find outliers in large data sets
Applications:
·
Credit card fraud detection
·
Telecom fraud detection
·
Customer segmentation
·
Medical analysis
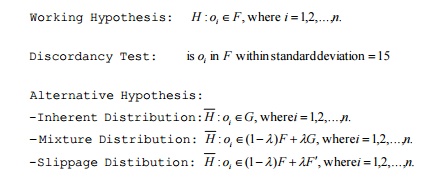
Statistical Distribution-based
outlier detection-Indentify the outlier with respect to the model using
discordancy test
How discordancy test work
Data is
assumed to be part of a working hypothesis (working hypothesis)-H
Each data
object in the dataset is compared to the working hypothesis and is either accepted
in the working hypothesis or rejected as discordant into an alternative
hypothesis (outliers)- H
Distance-Based outlier detection
Imposed
by statistical methods
We need
multi-dimensional analysis without knowing data distribution Algorithms for
mining distance-based outliers
Index-based
algorithm
Indexing Structures such as R-tree (R+-tree), K-D
(K-D-B) tree are built for the multi-dimensional database
The index is used to search for neighbors of each
object O within radius D around that object.
Once K (K = N(1-p)) neighbors of object O are
found, O is not an outlier.
Worst-case computation complexity is O(K*n2),
K is the dimensionality and n is the number of objects in the dataset.
Pros: scale well with K
Cons: the index construction process may cost much
time
Nested-loop algorithm
Divides the buffer space into two halves (first and
second arrays)
Break data into blocks and then feed two blocks
into the arrays.
Directly computes the distance between each pair of
objects, inside the array or between arrays
Decide the outlier.
Here comes an example:…
Same computational complexity as the index-based
algorithm
Pros: Avoid index structure construction
Try to minimize the I/Os n cell based algorithm
Divide the dataset into cells with length
K is the dimensionality, D is the distance
Define Layer-1 neighbors – all the intermediate
neighbor cells. The maximum distance between a cell and its neighbor cells is D
Define Layer-2 neighbors – the cells within 3 cell
of a certain cell. The minimum distance between a cell and the cells outside of
Layer-2 neighbors is D
Criteria
·
Search a cell internally. If there are M objects
inside, all the objects in this cell are not outlier
·
Search its layer-1 neighbors. If there are M
objects inside a cell and its layer-1 neighbors, all the objects in this cell
are not outlier
·
Search its layer-2 neighbors. If there are less
than M objects inside a cell, its layer-1 neighbor cells, and its layer-2
neighbor cells, all the objects in this cell are outlier
·
Otherwise, the objects in this cell could be
outlier, and then need to calculate the distance between the objects in this
cell and the objects in the cells in the layer-2 neighbor cells to see whether
the total points within D distance is more than M or not.
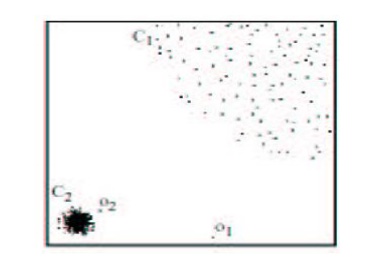
Density-Based Local Outlier
Detection
Distance-based outlier detection is based on global distance
distribution
It encounters difficulties to identify outliers if data is not uniformly
distributed
Ex. C1 contains 400 loosely distributed points, C2
has 100 tightly condensed points, 2 outlier points o1, o2
Some outliers can be defined as global outliers, some can be defined as
local outliers to a given cluster
O2 would not normally be considered an outlier with regular
distance-based outlier detection, since it looks at the global picture
Each data object is assigned a local
outlier factor (LOF)
Objects which are closer to dense clusters receive a higher LOF
LOF varies according to the parameter MinPts
Deviation-Based Outlier detection
Identifies outliers by examining the main
characteristics of objects in a group
Objects that ―deviate‖ from this description are
considered outliers
Sequential exception technique
simulates
the way in which humans can distinguish unusual objects from among a series of
supposedly
like objects
Dissimilarities are assed between
subsets in the sequence the techniques
introduce the
following
key terms
Exception
set, dissimilarity function, cardinality function, smoothing factor
OLAP data cube technique
Deviation detection process is overlapped with cube computation
Recomputed measures indicating data exceptions are needed
A cell value is considered an exception if it is significantly different
from the expected value, based on a statistical model
Use
visual cues such as background color to reflect the degree of exception
Related Topics