Chapter: Mechanical : Engineering materials and metallurgy : Mechanical Properties And Deformation Mechanism
Mechanical Properties and Deformation Mechanism
MECHANICAL PROPERTIES AND
DEFORMATION MECHANISM
1 Plastic deformation
2 Brinell hardness est
3 Vickers hardness test
4 Rockwell hardness test
5 Charpy impact test
6 Fatigue test
7 Creep test
1.PLASTIC DEFORMATION
Plastic
deformation is a change of the material dimensions remaining after removal of
the load caused the deformation. Plastic deformations in metals occur by “slip”
mechanism, illustrated in the picture:
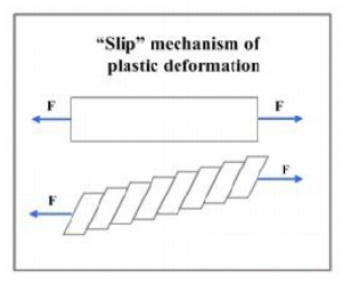
When the
yield stress is achieved one plane of atoms in crystal lattice glides over
another. Few parallel slip planes form a block, neighboring with another block.
Thus movement of the crystal planes is resulted in a series of steps, forming
slip bands - black lines viewed under optical microscope.
Slip
occurs when the share resolved stress along the gliding planes reaches a
critical value. This critical resolved shear stress is a characteristic of the
material.
Certain
metals (Zn and Sn) deform by a process of twinning, differing from the normal
slip mechanism, where all atoms in a block move the same distance. In the
deformation by twinning atoms of each slip plane in a block move different distance,
causing half of the crystal lattice to become a mirror image of another half.
In polycrystalline material directions of
slips are different in different crystals. If a grain is oriented unfavorably
to the stress direction its deformation is impeded. In addition to this grain
boundaries are obstacles for the Slip movement as the slip direction should be
changed when it crosses the boundary. As a result of the above strength of
polycrystalline materials is higher, than that of mono-crystals.
Slip and twinning processes, occurring during
plastic deformation result in formation of preferred orientation of the grains.
If the stress value required for a slip is higher than cohesion strength, metal
fracture occurs. Stress- strain relations are considered in Tensile test and
Stress-Strain Diagram.
Microscopically,
plastic deformation is a result of permanent distortion of lattice by extensive
rearrangement of atoms within it. There is an irreversible shear displacement
of one part of the crystal relative to another in a definite crystallographic
direction. This process is known as slip. Slip follows the path of least
energy. It coincides to the direction in which atoms are most closely packed.
In a
lattice, crystalline array of atoms are having linear imperfection, called
dislocation. Slip is considered as step-by-step movement Of dislocation within
a crystal. In well-annealed metals, density of dislocation is Not high enough
to cause such macroscopic deformation. Therefore, there must be some mechanism that
causes dislocations to multiply to a large number. Slip is one of such
mechanisms in which dislocations reproduce themselves.
There are
two types of dislocations: edge dislocation and screw dislocation. The edge
dislocation moves across the slip plane in the direction of applied shear
force. The direction of movement of screw dislocation is normal to the
direction of slip step. When slip occurs by combination of the two types of
dislocations, it results in a curved dislocation.
Another mechanism of plastic deformation that
occurs in Certain metals under certain circumstances is by twinning. In this
process, atoms In each successive plane within a block move different
distances. As a result The direction of the lattice is altered so that each
half of the crystal becomes A mirror image of the other half along a twinning
plane. In case of BCC structure, twinning occurs after some plastic deformation
or when stress is applied quickly.
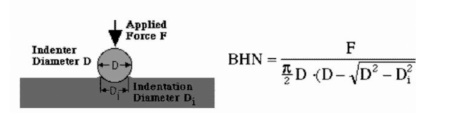
2.THE BRINELL HARDNESS TEST
The Brinell hardness test method consists of
indenting the test material with a 10 mm diameter hardened steel or carbide
ball subjected to a load of 3000 kg. For softer materials the load can be
reduced to 1500 kg or 500 kg to avoid excessive indentation. The full load is
normally applied for 10 to 15 seconds in the case of iron and steel and for at
least 30 seconds in the case of other metals. The diameter of the indentation
left in the test material is measured with a low powered microscope. The
Brinell harness number is calculated by dividing the load applied by the
surface area of the indentation.
The diameter of the impression is the average
of two readings at right angles and the use of a Brinell hardness number table
can simplify the determination of the Brinell hardness. A well structured
Brinell hardness number reveals the test conditions, and looks like this,
"75 HB 10/500/30" which means that a Brinell Hardness of 75 was
obtained using a 10mm diameter hardened steel with a 500 kilogram load applied
for a period of 30 seconds. On tests of extremely hard metals a tungsten
carbide ball is substituted for the steel ball. Compared to the other hardness
test methods, the Brinell ball makes the deepest and widest indentation, so the
test averages the hardness over a wider amount of material, which will more
accurately account for multiple grain structures and any irregularities in the
uniformity o f the material. This method is the best for achieving the bulk or
macro-hardness of a material, particularly those materials with heterogeneous
structures.
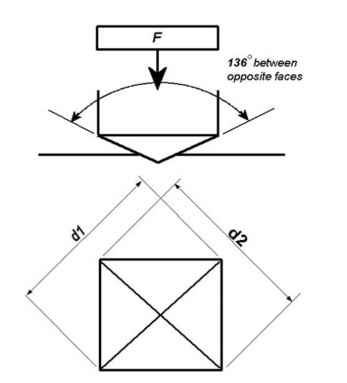
3 VICKERS HARDNESS TEST
The Vickers hardness test method consists of
indenting the test material with a diamond indenter, in the form of a right
pyramid with a square base and an angle of 136 degrees between opposite faces
subjected to a load of 1 to 100kgf. The full load is normally applied for 10 to
15 seconds. The two diagonals of the indentation left in the surface of the
material after removal of the load are measured using a microscope and their
average calculated. The area of the sloping surface of the indentation is
calculated. The Vickers hardness is the quotient obtained by dividing the kgf
load by the square mm area of indentation.
F= Load
in kgf
d =
Arithmetic mean of the two diagonals, d1 and d2 in mm HV = Vickers hardness
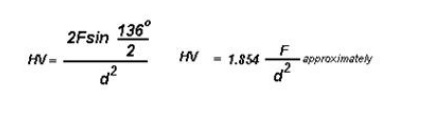
When the
mean diagonal of the indentation has been determined the Vickers hardness may
be calculated from the formula, but is more convenient to use conversion
tables. The Vickers hardness should be reported like 800 HV/10, which means a
Vickers hardness of 800, was obtained using a 10 kgf force. Several different
loading settings give practically identical hardness numbers on uniform
material, which is much better than the arbitrary changing of scale with the
other hardness testing methods. The advantages of the Vickers hardness test are
that extremely accurate readings can be taken, and just one type of indenter is
used for all types of metals and surface treatments. Although thoroughly
adaptable and very precise for testing the softest and hardest of materials,
under varying loads, the Vickers machine is a floor standing unit that is more
expensive than the Brinell or Rockwell machines.
4.ROCKWELL HARDNESS TEST
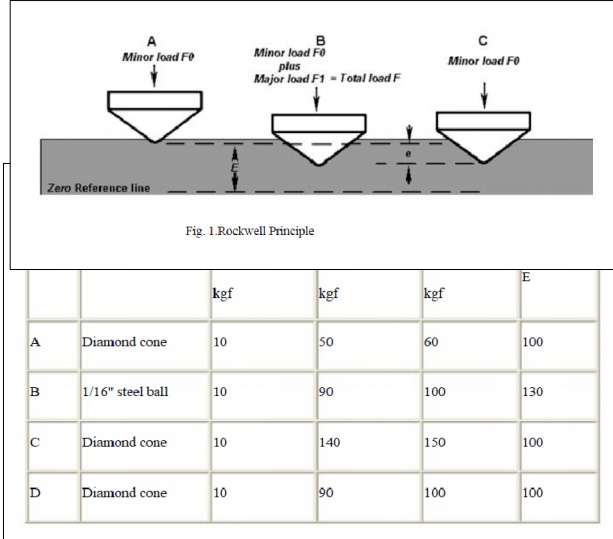
The
Rockwell hardness test method consists of indenting the test material with a
diamond cone or hardened steel ball indenter. The indenter is forced into the
test material under a preliminary minor load F0 (Fig. 1A) usually 10 kgf. When
equilibrium has been reached, an indicating device, which follows the movements
of the indenter and so responds to changes in depth of penetration of the
indenter is set to a datum position. While the preliminary minor load is still
applied an additional major load is applied with resulting increase in
penetration (Fig. 1B). When equilibrium has again been reach, the additional
major load is removed but the preliminary minor load is still maintained.
Removal of the additional major load allows a partial recovery, so reducing the
depth of penetration (Fig. 1C). The permanent increase in depth of penetration,
resulting from the application and removal of the additional major load is used
to calculate the Rockwell hardness number.
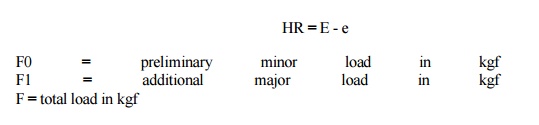
e =
permanent increase in depth of penetration due to major load F1 measured in
units of 0.002 mm
E = a
constant depending on form of indenter: 100 units for diamond indenter, 130
units for steel ball indenter
HR =
Rockwell hardness number
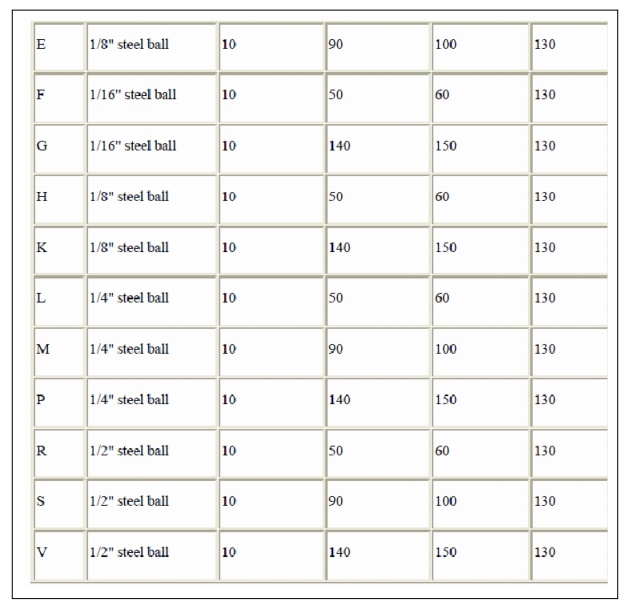
TYPICAL APPLICATION OF ROCKWELL HARDNESS SCALES HRA . . . .
Cemented
carbides, thin steel and shallow case hardened steel
HRB . . . .
Copper alloys, soft steels, aluminium alloys, malleable irons, etc.
HRC . . .
. Steel, hard cast irons, case hardened steel and other materials harder than
100 HRB HRD . . . . Thin steel and medium case hardened steel and pearlitic
malleable iron
HRE . . .
. Cast iron, aluminium and magnesium alloys, bearing metals
HRF . . .
. Annealed copper alloys, thin soft sheet metals
HRG . . .
. Phosphor bronze, beryllium copper, malleable irons HRH . . . Aluminium,
zinc,
lead
HRK . . .
. } HRL . . . . }
HRM . . .
.} . . . . Soft bearing metals, plastics and other very soft materials
HRP . . .
. }
HRR . . .
. }
HRS . . .
. }
HRV . . .
. }
Advantages of the Rockwell hardness method
include the direct Rockwell hardness number readout and rapid testing time.
Disadvantages include many arbitrary non-related scales And possible effects
from the specimen support anvil (try putting a cigarette paper under a test
block and take note of the effect on the Hardness reading! Vickers and Brinell
methods don't suffer from this effect).
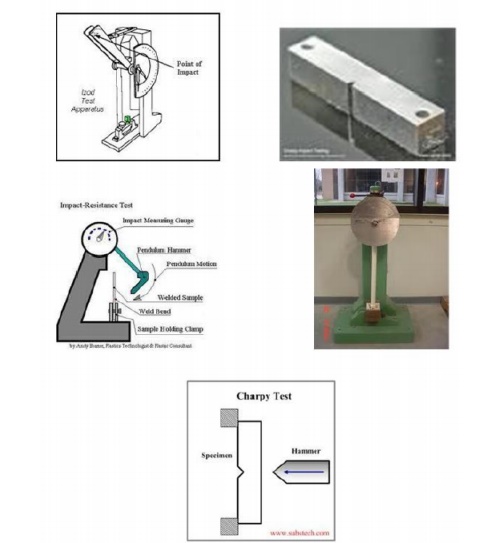
5.CHARPY IMPACT TEST
The Charpy impact test, also known as the
Charpy v-notch test, is a standardized high strain-rate test which determines
the amount of energy absorbed by a material during fracture. This absorbed
energy is a measure of a given material's toughness and acts as a tool to study
temperature- dependent brittle-ductile transition. It is widely applied in
industry, since it is easy to prepare and conduct and results can be obtained
quickly and cheaply. But a major disadvantage is that all results are only
comparative.
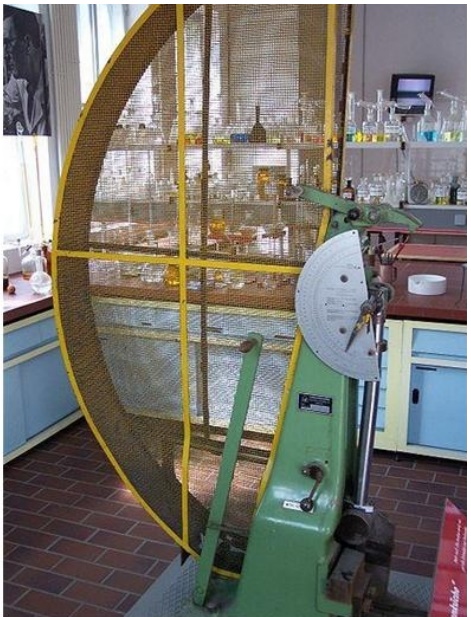
The apparatus consists of a pendulum axe
swinging at a notched sample of material. The energy transferred to the
material can be inferred by comparing the difference in the height of the
hammer before and after a big fracture.
The notch in the sample affects the results of
the impact test, thus it is necessary for the notch to be of regular dimensions
and geometry. The size of the sample can also affect results, since the
dimensions determine whether or not the material is in plane strain.
This
difference can greatly affect conclusions made.
where all the aspects of the test and
equipment used are described in detail.
Quantitative results
The
quantitative result of the impact tests the energy needed to fracture a
material and can be used to measure the toughness of the material and the yield
strength. Also, the strain rate may be studied and analyzed for its effect on
fracture.
The
ductile-brittle transition temperature (DBTT) may be derived from the
temperature where the energy needed to fracture the material drastically
changes. However, in practice there is no sharp transition and so it is
difficult to obtain a precise transition temperature. An exact DBTT may be
empirically derived in many ways: a specific absorbed energy, change in aspect
of fracture (such as 50% of the area is cleavage), etc.
Qualitative results
The
qualitative results of the impact test can be used to determine the ductility
of a material. If the material breaks on a flat plane, the fracture was
brittle, and if the material breaks with jagged edges or shear lips, then the
fracture was ductile. Usually a material does not break in just one way or the
other, and thus comparing the jagged of the to flat surface areas fracture will
give an estimate of the percentage of ductile and brittle fracture.
Sample sizes
According
to ASTM A370,the standard specimen size for Charpy impact testing
Subsize specimen sizes are:
is
10mm×10mm×55mm.
10mm×7.5mm×55mm,
10mm×6.7mm×55mm,
10mm×5mm×55mm,
10mm×3.3mm×55mm,
10mm×2.5mm×55mm.
Details
of specimens as per ASTM A370 (Standard Test Method and Definitions for
Mechanical Testing of Steel Products).
6.FATIGUE TEST
In
materials science, fatigue is the progressive and localized structural damage that
occurs when a material is subjected to cyclic loading. The nominal maximum
stress values are less than the ultimate tensile stress limit, and may be below
the yield stress limit of the material.
Fatigue
occurs when a material is subjected to repeated loading and unloading. If the
loads are above a certain threshold, microscopic cracks will begin to form at
the surface. Eventually a crack will reach a critical size, and the structure
will suddenly fracture. The shape of the structure will significantly affect
the fatigue life; square holes or sharp corners will lead to elevated local
stresses where fatigue cracks can initiate. Round holes and smooth transitions
or fillets are therefore important to increase the fatigue strength of the
structure.
Characteristics of fatigue
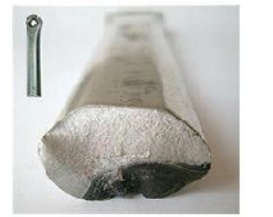
Fracture
of an aluminium crank arm. Dark area of striation s: slow crack growth. Bright
granular are a: sudden fracture.
• In
metals and alloys, the process starts w ith dislocation movements,eventually
forming persistent slip bands that nucleate short cracks.
• Fatigue
is a st ochastic process, often showing considerable scatter even in controlled
environments.
• The
greate r the applied stress range, the shorter the life. F atigue life scatter
tends to increase for longer fatigue lives. Damage is cumulative. Materials do
not Recover when rested. Fatigue life is influence d by a variety of factors,
su ch as temperature, surface finish, microstructure, presence of oxidizing or
inert chemicals, residual stresses, contact (fretting), etc.
• Some
materials (e.g.,some steel and titanium alloys) exhibit a theoretical fatigue
limit below which continued loading does not lead to structural failure.
• In
recent years, researchers have found that failures o ccur below the theoretical
fatigue limit at very high fatigue lives (109 t o 1010 cycles). An ultrasoni c
resonance technique is used in these experiments w ith frequencies around 10-20
kHz
• High
cycle fatigue strength (about 103 to 108 cycles) can be described by
load-controlled servo-hydraulic test rig is stress-basedpar ameters. A commonly
us ed in these tests, with frequencies of aro und 20-50 Hz. Other sorts o f
machines like resonant magnetic machines can also be used, achieving
frequencies up to 250 Hz.
• Low
cycle fatigue (typically less than 103 cycles) is associated with wide spread
plasticity in metals; thus, a strain-based param eter should be used for fatig
ue life prediction in metals and alloys . Testing is conducted with constant
strain amplitudes typically at 0.01 -5 Hz.
FACTORS THAT AFFECT FATIGUE-LIFE
Cyclic stress state: Depending
on the compl exity of the geometry and the loading, one or more properties of
the stress state need t o be considered, such as stress am plitude, mean
stress, biaxial ity, in- phase or out-of-phase shear stress, and load sequence,
Geomet ry: Notches
and variation in cross section throughout a part lead to stress concentrations
where fatigue cracks initiate.
Surface quality: Surface roughness cause micro
scopic stress concentrations that lower the fatigu e strength.
Compressive
residual stresses can be introduced in the surface by e.g. shot peening to
increase fatigue life. Such techniques for producing surface stress are often
referred to as peening, whatever the mechanism used to produce the stress. Low
Plasticity Burnishing, Laser peening, and ultrasonic i mpact treatment can also
produce this surface compressive stress and can increase the fatigu e life of
the component. This improvement is normally observed only for high-cycle f
atigue.
aterial Type: Fatigue life, as well as the
behavior during cyclic loading, varies widely for different m aterials, e.g.
composites and polymers differ markedly from metals.
Residual stresses: Welding,
cutting, ca sting, and other manufac turing processes involving heat or
deformation can produce high levels of tensile residual stress, which decrea
ses the fatigue strength.
Size and distribution of internal defects: Ca sting
defects such as gas porosity, non-metallic inclusions and shrinkage voids can
significantly reduce fatigue strength.
Direction of loading: For
non-isotropic materials, fatigue strength depe nds on the direction of the
principal stress.
Grain size: For most metals, smaller grains
yield longer fatigue lives, however, the presence of surface defects or
scratches w ill have a greater influence th an in a coarse grain ed alloy.
Environment: Environmental conditions can
cause erosion, corros ion, or gas-phase embrittlement, which all affect fatigue
life. Corrosion fatigue is a problem encountered in many aggres sive
environments.
Temperature: Extreme high or low tempe ratures
can decrease fatigu e strength.
DESIGN AGAINST FAT IGUE
Dependable
design against fatigue-failure requires thorough Education and supervised
experience in structural engineering,
mechanical
engineering, or materials science. There are three principal
approaches
to life assurance for mechanical parts that display increasing degrees
of
sophistication:
1. Design to keep stress below threshold of
fatigue limit (infinite lifetime concept);
2. Design (conservatively) for a fixed life
after which the user is instructed to replace the part with a new one (a
so-called Lifed part, finite lifetime concept, or "safe-life" design
practice);
3. Instruct the user to inspect the part
periodically for cracks And to replace the part once a crack exceeds a critical
length. This approach usually uses the technologies of nondestructive testing
and requires an accurate prediction of the rate of crack-growth between
inspections.
This is often referred to as damage tolerant
design or "retirement-for- cause".
STOPPING FATIGUE
Fatigue cracks that have begun to propagate
can sometimes be stopped by drilling holes, called drill stops, in the path of
the fatigue crack This is not recommended as a general practice because the
hole Represents a stress concentration factor which depends on the size of the
Hole and geometry. There is thus the possibility of a new crack starting in the
side of the hole. It is always far better to replace the cracked part entirely.
MATERIAL CHANGE
Changes in the materials used in parts can
also improve fatigue life. For example, parts can be made from better fatigue
rated metals. Complete replacement and redesign of parts can also reduce if not
eliminate fatigue problems. Thus helicopter rotor blades and propellers in
metal are being replaced by composite equivalents. They are not only lighter,
but also much more resistant to fatigue. They are more expensive, but the extra
cost is amply repaid by their greater integrity, since loss of a rotor blade
usually leads to total loss of the aircraft. A similar argument has been made
for replacement of metal fuselages, wings and tails of aircraft.
7.CREEP TEST
Method
for determining creep or stress relaxation behavior. To determine creep
properties, material is subjected to prolonged constant tension or compression
loading at constant temperature. Deformation is recorded at specified time
intervals and a creep vs. time diagram is plotted. Slope of curve at any point
is creep rate. If failure occurs, it terminates test and time for rupture is
recorded. If specimen does not fracture within test period, creep recovery may
be measured. To determine stress relaxation of material, specimen is deformed a
given amount and decrease in stress over prolonged period of exposure at
constant temperature is recorded Viscoplasticity is a theory in continuum
mechanics that describes the rate-dependent inelastic behavior of solids.
Rate-dependence in this context means that the deformation of the material
depends on the rate at which loads are applied. The inelastic behavior that is
the subject of viscoplasticity is plastic deformation which means that the
material undergoes unrecoverable deformations when a load level is reached.
Rate-dependent plasticity is important for transie nt plasticity calculations.
The main difference between rate- independ ent plastic and viscoplastic
material models is that the latter exhibit not only permanent deformations
after the application of loads but continue to undergo a creep flow as a
function of time under the influence of the applied load.
The
elastic respon se of viscoplastic materials can be represented in one-
dimension by Hookean spring elements. Rate- dependence can be represented by
nonlinear dashpot elemen ts in a manner similar to viscoelasticity. Plasticity
can be accounted for by adding sliding frictional elements as shown in Figure
1.In the figure E is the modulus of elasticity, λ is the viscosity parameter
and N is a power-law type parameter that represents non-linear dashpot
σ(dε/dt)= σ = λ(dε/dt)(1/ N)]. The sliding element can have a yield stress (σy)
that is strain rate dependent, or e ven constant, Viscoplasticity is usually
modeled in three -dimensions using overstress models of the Perzyna or
Duvaut-Lions types. In these models, the stress is allo wed to increase beyond
the rate-independent yield surface upon application of a load and then allowed
to relax back to the yield surface over time. The yield surrface is usually
assumed not to be rate-dependent in such models. An alternativ e approach is to
add a strain rate depen dence to the yield stress and use the techhniques of
rate independent plasticity to calculate the response of a material For metals
and alloys, viscoplasticity is the macroscopic behavior caused by a mechanism
linked to the movement of dislocation s in grains, with superposed effects of
inter-crystalline gliding. The mechanism usually becomes dominant at temperatur
es greater than approximately one third o f the absolute melting temperature.
However, certain alloys exhibit viscoplasticity at room temperature (300K). For
polymer s, wood, and bitumen, the theory of viscoplasticity is required to
describe beha vior beyond the limit of elasticity or viscoelasticity.
In
general, viscoplasticity theories are useful in areas such as the calculation
of permanent deformations, the prediction of the plastic collapse of
structures, the investigation of stability, crash simulations, systems exposed
to hig h temperatures such as turbines in engines, e.g. a power plant, dynamic
problem s and systems exposed to high strain rates. dels of rate-independent
plasticity that have a rate-dependent yield stress.
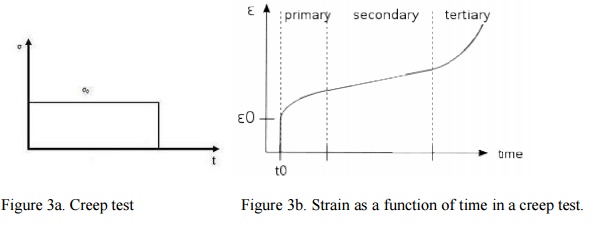
Creep is the tendency of a solid material to slowly move or defor m permanently under constant stresses. Creep tests measure the strain response due to a constant stress as shown in Figure 3. The classical creep curve represents the evolution of strain as a function of time in a material subjected to uniaxial stre ss at a constant temperature. The creep test, for instance, is performed by apply ing a constant force/stress and analyzing the strain response of the system. In gener al, as shown in Figure 3b this curve usually shows three phases or periods of behavior A primary creep stage, also known as transient creep, is the starti ng stage during which hardening of the material leads to a decrease in the rate of flow which is initially very high.
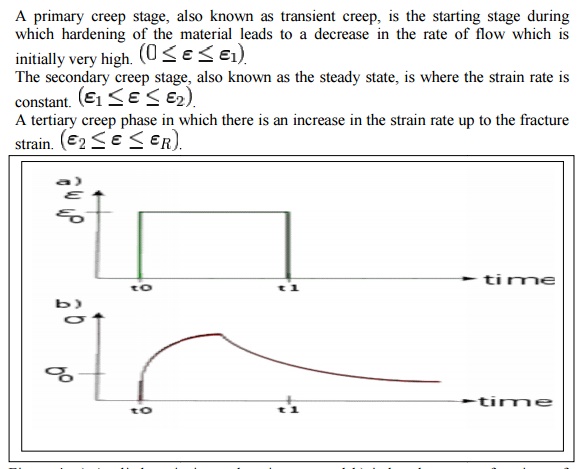
Figure 4.
a) Applied strai n in a relaxation test and b) induced stress as functions of
time over a short period for a viscoplastic material.
As shown
in Figure 4, th e relaxation test is defined as the stress res ponse due to a
constant strain for a p eriod of time. In viscoplastic materials, relaxation
tests demonstrate the stress rel axation in uniaxial loading at a constant
strain. In fact, these tests characterize the viscosity and can be used to
determine the relation which exists between the stress and th e rate of
viscoplastic strain. The decomposit on of strain rate is
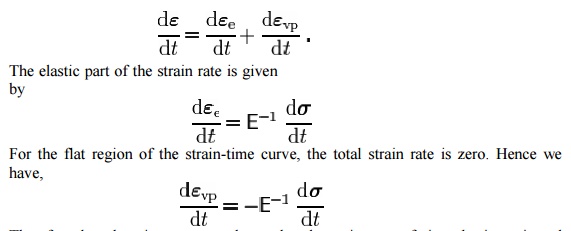
Therefore
the relaxation curve can be used to determine rate of viscoplastic strain and
hence the viscosity of the dashpot in a one-dimensional viscoplastic material
model. The residual value that is reached when the stress has plateaued a t the
end of a relaxation test corresponds to the upper limit of elasticity. For some
m aterials such as rock salt such an upper limit of elasticity occurs at a very
small val ue of stress and relaxation tests can be co ntinued for more than a
year without any ob servable plateau in the stress.
It is
important to note that relaxation tests are extremely difficult to perform
because

Tensile testing, also known as tension testing, is a fundamental materials science test in which a sa mple is subjected to uniaxial tension until fail ure. The results from the test are commo nly used to select a material for an application, for quality control, and to predict how a material will react under other t ypes of forces. Properties that are directly measured via a tensile test are ultimate t ensile strength, maximum elongation and reduction in area. From these m easurements the following properties can also be determined: Young's modulus, Poisson's ratio, yield strength, and strain-harde ning characteristics.
Tensile
specimens made from an aluminum alloy. The left two sp ecimens have a round
cross-section and threaded shoulders. The right two are flat specimen designed
to be used with s errated grips.
A tensile
specimen is a standardized sample cross-section. It has two shoulders and a
gage section in between. The shoulders are large so they can be readily
gripped, where as the gage section has a smaller cross-section so that the
deformation and failure can occur in this area.
The
shoulders of the test specimen can be manufactured in various ways to mate to
various grips in the testing machine (see the image below). Each system has
advantages and disadvantages; for example, shoulders designed for se rrated
grips are easy and cheap to manuufacture, but the alignment of the specim en is
dependent on the skill of the tech nician. On the other hand, a pinned gri p
assures good alignment. Threaded sh oulders and grips also assure good alig
nment, but the technician must know to thread each shoulder into the grip at
least one diameter's length, otherwise the threads can strip before the
specimen fractures.
In large
castings and forgi ngs it is common to add extra material, which is designed to
be removed from the casting so that test specimens can be made from it. These
specimen not be exact representation of the whole workpiece be cause the grain
structure may be different throughout. In smaller workpieces or when critical
parts of the casting must be te sted, a workpiece may be sacrificed to make the
test specimens.For workpieces that are machined from bar stock, the test
specimen can be made from the same piece as the bar stock.
The
repeatability of a testing machine can be found by using special test specimens
meticulously made to be a s similar as possible.
Related Topics