Time Series and Forecasting - Measurements of Components | 12th Statistics : Chapter 7 : Time Series and Forecasting
Chapter: 12th Statistics : Chapter 7 : Time Series and Forecasting
Measurements of Components
(i) Secular trend
It refers to the long term tendency of the data to move in an
upward or downward direction. For example, changes in productivity, increase in
the rate of capital formation, growth of population, etc ., follow
secular trend which has upward direction, while deaths due to improved medical
facilities and sanitations show downward trend. All these forces occur in slow
process and influence the time series variable in a gradual manner.
Methods of Measuring Trend
Trend is measured using by the following methods:
1. Graphical method
2. Semi averages method
3. Moving averages method
4. Method of least squares
(ii) Seasonal variation
Seasonal variations are fluctuations within a year over different
seasons.
Estimation of seasonal variations requires that the time series
data are recorded at even intervals such as quarterly, monthly, weekly or
daily, depending on the nature of the time series. Changes due to seasons,
weather conditions and social customs are the primary causes of seasonal
variations. The main objective of the measurement of seasonal variation is to
study their effect and isolate them from the trend.
Methods of constructing seasonal indices
There are four methods of constructing seasonal indices.
1. Simple averages method
2. Ratio to trend method
3. Percentage moving average method
4. Link relatives method
Among these, we shall discuss the construction of seasonal index
by the first method only.
(iii) Cyclical variation
Cyclical variations refer to periodic movements in the time series
about the trend line, described by upswings and downswings. They occur in a
cyclical fashion over an extended period of time (more than a year). For
example, the business cycle may be described as follows.
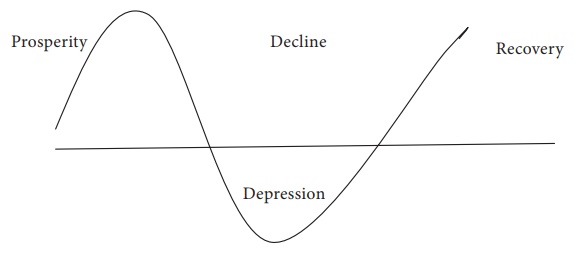
The cyclical pattern of any time series tells about the prosperity
and recession, ups and downs, booms and depression of a business. In most of
the businesses there are upward trend for some time followed by a downfall,
touching its lowest level. Again a rise starts which touches its peak. This
process of prosperity and recession continues and may be considered as a
natural phenomenon.
(iv) Irregular variation
In practice, the changes in a time series that cannot be
attributed to the influence of cyclic fluctuations or seasonal variations or
those of the secular trend are classified as irregular variations.
In the words of Patterson, “Irregular variation in a time series
is composed of non-recurring sporadic (rare) form which is not attributed to
trend, cyclical or seasonal factors”.
Nothing can be predicted about the occurrence of irregular
influences and the magnitude of such effects. Hence, no standard method has
been evolved to estimate the same. It is taken as the residual left in the time
series, after accounting for the trend, seasonal and cyclic variations.
Related Topics