Kinetic Theory of Gases - Maxwell-Boltzmann speed distribution function | 11th Physics : UNIT 9 : Kinetic Theory of Gases
Chapter: 11th Physics : UNIT 9 : Kinetic Theory of Gases
Maxwell-Boltzmann speed distribution function
Maxwell-Boltzmann speed distribution function
In a classroom, the air molecules are moving in random directions. The speed of each molecule is not the same even though macroscopic parameters like temperature and pressure are fixed. Each molecule collides with every other molecule and they exchange their speed. In the previous section we calculated the rms speed of each molecule and not the speed of each molecule which is rather difficult. In this scenario we can find the number of gas molecules that move with the speed of 5 m s−1 to 10 m s−1 or 10 m s−1 to 15 m s−1 etc. In general our interest is to find how many gas molecules have the range of speed from v to v + dv. This is given by Maxwell’s speed distribution function.
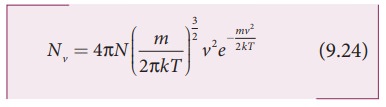
The above expression is graphically shown as follows
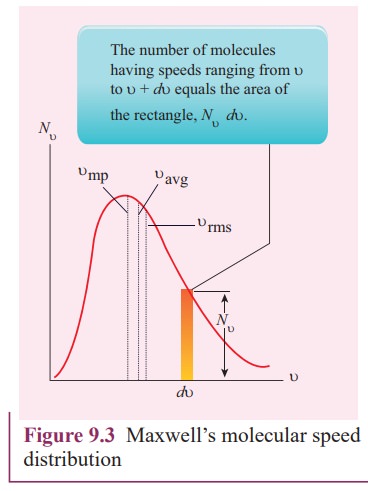
From the Figure 9.3, it is clear that, for a given temperature the number of molecules having lower speed increases parabolically but decreases exponentially after reaching most probable speed. The rms speed, average speed and most probable speed are indicated in the Figure 9.3. It can be seen that the rms speed is greatest among the three.
To know the number of molecules in the range of speed between 50 m s−1 and 60 m s−1, we need to integrate
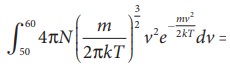
= N(50 to 60 ms−1). In general the number of molecules within the range of speed v and v+dv is given by
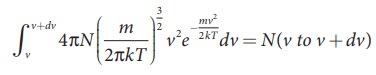 .
.
The exact integration is beyond the scope of the book. But we can infer the behavior of gas molecules from the graph.
(i) The area under the graph will give the total number of gas molecules in the system
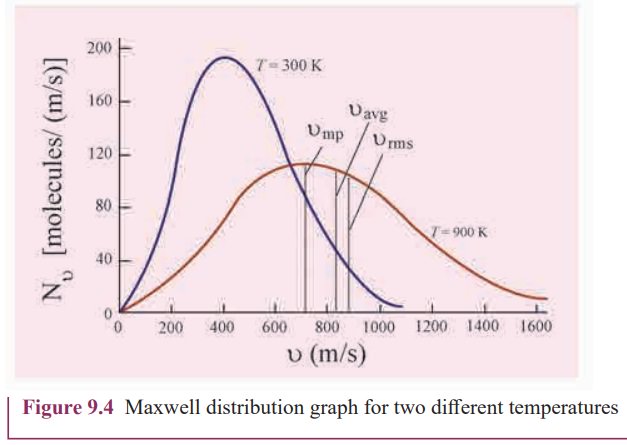
(ii)„Figure 9.4 shows the speed distribution graph for two different temperatures. As temperature increases, the peak of the curve is shifted to the right. It implies that the average speed of each molecule will increase. But the area under each graph is same since it represents the total number of gas molecules.
Related Topics