Chapter: Mechanical : Total Quality Management (TQM) : TQM Tools & Techniques
Management Tool: Relations Diagram
New Seven management Tools
It is a simple and effective tool. This approach focuses on the process (to reveal the causes), rather than the people.
Example: Why was there a delay in dispatch of good? Cutting tool failed, resulting in delay in manufacture. Why? The tools were reused?
Why? Ordered tool were not delivered?
Solution changes the dispatch schedule, if ever the tools were not delivered.
Forced Field Analysis
ReadersŌĆÖ attention is invited to the discussion in Chapter 2 on this topic.
Nominal Group Technique
This technique provides for ideas input from every one in the team and for effective decision making.
A team wants to decide upon a current complaint to attend. Every one in the team writes the problem on a paper, what they think is most important. They are listed in a chart and then the team members are asked to rank, from most important to least important. The ranking are given a numerical value starting from, say, on a 10 to 1 scale. Points for each problem is totaled and the ones with highest number of points, is considered o be the most important.
The seven advanced tools of quality management or the ŌĆśNew SevenŌĆÖ is a collection of tools put together by a set of Japanese quality professionals. , Arrow Diagram, was known to engineers and project managers by names like PERT (Programme Evaluation and Review Technique) or CMP (Critical Mean Path). Another tool in this set PDPC (Process Decision Programme Chart) has been used in operations research.
CONCEPT
These tools, unlike SPC tools are qualitative tools. Most of these tools do not involve the use of numerical data.
. Like all management tools these are judgmental tools.
Managers are often called upon to make decisions based on their judgement with help of incomplete information or on subjective issues.
Team work and techniques like brainstorming are very essential for best results with such tools.
The seven tools we will see are :
1. Affinity diagram
2. Relations diagram
3. Tree diagram
4. Matrix diagram
5. Matrix data analysis diagram .
6 .Process decision programme chart
7. Arrow diagram
Relations Diagram
Purpose
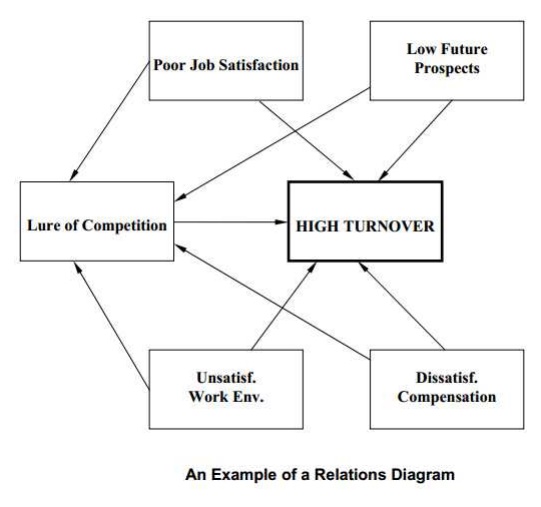
The purpose of relations diagram is to generate a visual representation of the relations between an effect and its causes as well as the interrelationship between the causes in complex problems.
Structure
As mentioned in the opening paragraph of the chapter, the structure of relations diagram is not very rigid; it is quite flexible. Only thing fixed about the diagram is a bold bordered rectangle in which the ŌĆśeffectŌĆÖ is written. The causes are entered in light rectangles and lines are drawn to show relation between the rectangles. The lines have arrows at one end showing which is the cause and which is the effect - the arrow always leading from the cause to the effect. The most common shape the diagram takes has the ŌĆśeffectŌĆÖ at the centre, with immediate causes surrounding it and secondary and tertiary causes as outer layers.
Procedure
To prepare a relations diagram, there is a need for a large number of causes. No single individual can generate an exhaustive list of causes.
Hence the tool gives best results when it is used in a group. The group must brainstorm the subject to get the maximum number of causes.
The steps in the preparation of a relations diagram are:
1. Decide the ŌĆśeffectŌĆÖ or the problem for which causes are to be found.
Write is in the centre of the flip chart or a board and enclose it in a dark bordered rectangle.
Discuss the subject and confirm the ŌĆśeffectŌĆÖ.
2. Brainstorm to identify the immediate causes for the effect first. Enter these in rectangles around the central dark rectangle.
Take care to place causes likely to be related to one another in adjacent positions.
It is quite possible that the locations of the causes may have to be changed as one progresses.
Hence a white board is preferable to a flip chart for this exercise. If a flip chart is used, the causes may be written on post-it pads and stuck on the chart so that their location can be changed easily.
3. Connect these immediate causes to the effect by connecting the rectangles of the causes to that of the effect with a line with an arrow pointing towards the effect. Explore the cause and effect relationship among the immediate causes and connect them, keeping in mind that
the arrow always points to an effect.
4. Taking each of these immediate causes as an effect, brainstorm to find causes for them one by one.
The key question for identifying causes is ŌĆ£why ?ŌĆØ. Keep asking the question till the root causes are
identified for the immediate, secondary and tertiary causes.
5. Explore the relationship between all the causes and connect the rectangles as in step-3. Show as many relations among different causes as possible. A large number of routes leading to the same root causes provides an indication that the root cause may be an important contributor to the problem.
6. Brainstorm to find the more important root causes and more prominent links leading to the effect. Mark these by making the rectangles and the connecting lines darker.
7. If necessary, rearrange the rectangles in such a way that the connecting lines are short and the diagram compact.
9. Provide a suitable title to the diagram.
Applications
Relations diagram can be applied to explore cause and effect relationships, especially in complex situations where the causes are likely to be mutually related. The most common use is in problem solving to identify multiple interrelated causes. The output of the tool is a list of root causes for the problem with some indication of their relative importance. The output has to be considered as only an indication of the relative importance of the causes. Data has to be collected to confirm or reject the conclusions arrived at the end of the session. Priority of corrective actions to eliminate the causes should be based on the data collected, not on output of relations diagram. The output of relations diagram is based on the perception of the members of the group brainstorming the issue; it needs to be supported by facts. While the output is important as it points a direction to data collection efforts, it is no substitute for facts and data.
Relations diagram
Related Topics