Chapter: Mechanical : Total Quality Management (TQM) : TQM Tools & Techniques
Management Tool: Matrix Diagram
New Seven management Tools
It is a simple and effective tool. This approach focuses on the process (to reveal the causes), rather than the people.
Example: Why was there a delay in dispatch of good? Cutting tool failed, resulting in delay in manufacture. Why? The tools were reused?
Why? Ordered tool were not delivered?
Solution changes the dispatch schedule, if ever the tools were not delivered.
Forced Field Analysis
ReadersŌĆÖ attention is invited to the discussion in Chapter 2 on this topic.
Nominal Group Technique
This technique provides for ideas input from every one in the team and for effective decision making.
A team wants to decide upon a current complaint to attend. Every one in the team writes the problem on a paper, what they think is most important. They are listed in a chart and then the team members are asked to rank, from most important to least important. The ranking are given a numerical value starting from, say, on a 10 to 1 scale. Points for each problem is totaled and the ones with highest number of points, is considered o be the most important.
The seven advanced tools of quality management or the ŌĆśNew SevenŌĆÖ is a collection of tools put together by a set of Japanese quality professionals. , Arrow Diagram, was known to engineers and project managers by names like PERT (Programme Evaluation and Review Technique) or CMP (Critical Mean Path). Another tool in this set PDPC (Process Decision Programme Chart) has been used in operations research.
CONCEPT
These tools, unlike SPC tools are qualitative tools. Most of these tools do not involve the use of numerical data.
. Like all management tools these are judgmental tools.
Managers are often called upon to make decisions based on their judgement with help of incomplete information or on subjective issues.
Team work and techniques like brainstorming are very essential for best results with such tools.
The seven tools we will see are :
1. Affinity diagram
2. Relations diagram
3. Tree diagram
4. Matrix diagram
5. Matrix data analysis diagram .
6 .Process decision programme chart
7. Arrow diagram
Matrix Diagram
Purpose
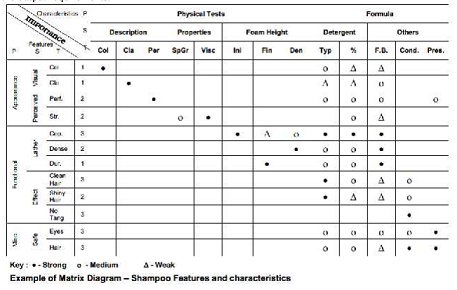
The purpose of a matrix diagram is to explore the existence and the extent of relations between individual items in two sets of factors or features or characteristics and express them in a symbolic form that is easy to understand. The purpose for which the tool is most frequently used is to understand the relation between customer expectations as expressed by the customers and product characteristics as designed, manufactured and tested by the manufacturer.
Procedure
The steps in the procedure to prepare a matrix diagram are :
1. Decide the two sets of factors for which relations are required to be clarified. Call the set of the main factors ŌĆśfeaturesŌĆÖ and the set of factors dependent on it counterpart ŌĆścharacteristicsŌĆÖ or
characteristics.
2. Divide the features into primary, secondary and tertiary features.
3. Divide the characteristics into primary, secondary and tertiary characteristics.
4. Place the features vertically on the left hand side of the matrix and characteristics horizontally on top of the matrix.
5. Enter the importance of the features on the column after that for the tertiary features.
6. In the main body of the matrix, place symbols at the squares denoting the relationship between thefeature and the characteristic meeting at the intersection. The symbols to be used are :
- Strong relationship - Medium relationship - Weak relationship
In case there is no relation between the concerned feature and characteristic, leave the square blank to indicate ŌĆśno relationŌĆÖ. The relationship should be based on data available with the team or on the
results of a brainstorming session which must be confirmed by collecting necessary data.
7. Title the diagram suitably. ApplicationsMatrix diagram, being a very simple table showing relations between individual items in two sets of factors, can be put to a wide variety of uses.
The symbolic representation of the relationship makes the diagram so much easier to understand as compared to a table with a lot of figures. Let us see some of the possible applications of a matrix diagram.
Matrix diagram can be used to solve problems by arranging data in such a way that the relations between relevant factors are brought into sharp focus. It can be used to understand relations between
customer satisfaction and product characteristics, between complaints and product groups, between complaints and geographical regions, between a productŌĆÖs performance in the market and
promotional inputs on it and so on. Once the relations between individual items in sets of factors are clearly understood and agreed upon, it becomes easy to solve problems and to plan and implement solutions systematically.
There is no limit to the use of the tool. The unlimited possibility of the application of the tool is proved by a couple of unusual examples. A book on
QC tools written by Japanese authors gives an example where the tool was used to describe the relations between male and female members of the staff in an office. A recent article in a magazine brought out by an NBFC (Non Banking Finance Company) for the benefit of investors used the matrix diagram to depict the vulnerability of different industries. The diagram provides relation between 24 industries from Aluminium and Automobiles to tyres and yarn with half a dozen parameters such as over-capacity, demand recession, cheap imports etc. The matrix had symbols indicating high, moderate, slight or no vulnerability of the industry on that parameter. The only difference is that the symbols used were not the same as those conventionally used in a matrix diagram. The most important application of matrix diagram is in clarifying relations
between individual features of customer requirements and individual product characteristics. Thus the tool enables one to translate customer expectations into technical specifications accurately. In other words it helps one develop a product specification that will satisfy customer expectations. Its use can be extended to clarify the relationship between product characteristics on one side and product formulation and process parameters on the other side. In other words it can be used to generate a process specification that would ensure compliance to the requirements of a product specification. It can be used to develop specification requirements for inputs to a process by studying their relation to the output requirements.
Related Topics