Chapter: Mechanical : Engineering Economics & Cost Analysis : Introduction to Economics
Introduction to Economics
INTRODUCTION TO ECONOMICS
Introduction
Efficient functioning of any
business organization would enable it to provide goods/services at a lower
price.
In the process of managing
organizations, the managers at different levels should take appropriate
economic decisions which will help in minimizing investment, operating and
maintenance expenditures besides increasing the revenue, savings and such other
gains of the organization.
These can be achieved through
Engineering Economics which deals with the methods that enable one to make
economic decisions towards minimizing costs and/or maximizing benefits to
business organizations.
This chapter discusses the elements
of economics and the interaction between its various components.
This is followed by an analysis of
the need and scope of engineering economics. Later, elements of cost and
break-even analysis are presented.
Economics - is a
study of economic problems of the people concerning production, consumption,
exchange and distribution of wealth.
Economics is the science that deals with the
production and consumption of goods and services and the distribution and
rendering of these for human welfare.
The
following are the economic goals.
ü A high level
of employment
ü Price
stability
ü Efficiency
ü An
equitable distribution of income
ü Growth
Flow in economy The flow
of goods, services, resources and money payments in a simple economy
Households
and businesses are the two major entities in a simple economy.
Business
organizations use various economic resources
like land, labour
and capital which are provided
by households to produce consumer
goods and services
which will be used
by them.
Business
organizations make payment of
money to the
households for receiving
various resources.
ü The households in turn make payment of money to business
organizations for receiving consumer goods and services.
üThis cycle shows the interdependence between the
two major entities in a simple economy.
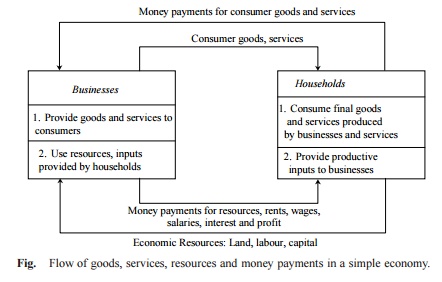
Fig. Flow of goods, services, resources and money payments in a
simple economy.
Laws of supply and demand
i.Laws of supply - states
that the quantity of a commodity supplied varies directly with the
price, other determinants of supply remaining constant.
ü If the cost of inputs increases, then naturally, the cost of the
product will go up. In such a situation, at the prevailing price of the product
the profit margin per unit will be less.
ü The producers will then reduce the production quantity, which in
turn will affect the supply of the product.
ü For instance, if the prices of fertilizers and cost of labour
are increased significantly, in agriculture, the profit margin per bag of paddy
will be reduced.
ü So, the farmers will reduce the area of cultivation, and hence
the quantity of supply of paddy will be reduced at the prevailing prices of the
paddy.
ü If there is an advancement in technology used in the manufacture
of the product in the long run, there will be a reduction in the production
cost per unit.
ü This will enable the manufacturer to have a greater profit
margin per unit at the prevailing price of the product. Hence, the producer
will be tempted to supply more quantity to the market.
ü Weather also has a direct bearing on the supply of products. For
example, demand for woollen products will increase during winter. This means
the prices of woollen goods will be incresed in winter.
ü So, naturally, manufacturers will supply more volume of woollen
goods during winter.
Factors influencing supply
The shape of the supply curve is affected by the following
factors:
ü Cost of the inputs
ü Technology
ü Weather
ü Prices of related goods
ii.Law of demand states
that other things being equal demand when price falls and contracts when
price rises.
·
Market demand is the
total quantity demanded by all the purchasers together.
·
Elasticity of Demand -
Elasticity of demand may be defined as the degree of responsiveness of
quantity demanded to a Change in price.
ü An interesting aspect of the economy is that the demand and
supply of a product are interdependent and they are sensitive with respect to
the price of that product. .
ü From Fig. it is clear that when there is a decrease in the price
of a product, the demand for the product increases and its supply decreases.
ü Also, the product is more in demand and hence the demand of the
product increases.
ü At the same time, lowering of the price of the product makes the
producers restrain from releasing more quantities of the product in the market.
ü Hence, the supply of the product is decreased. The point of
intersection of the supply curve and the demand curve is known as the
equilibrium point.
ü At the price corresponding to this point, the quantity of supply
is equal to the quantity of demand. Hence, this point is called the equilibrium
point.
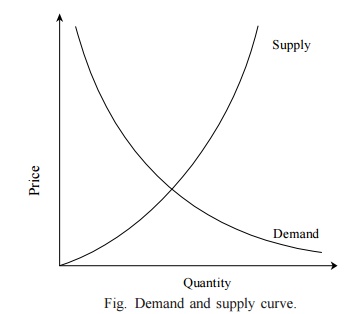
Fig.
Demand and supply curve.
Factors influencing demand
The shape of the demand curve is influenced by the following
factors:
ü Income of the people
ü Prices of related goods
ü Tastes of consumers
Concept of Engineering Economics
ü Science is a field of study where the basic principles of
different physical systems are formulated and tested.
ü Engineering is the application of science. It establishes varied
application systems based on different scientific principles.
ü From the discussions in the previous section, it is clear that
price has a major role in deciding the demand and supply of a product.
ü Hence, from the organization’s point of view, efficient and
effective functioning of the organization would certainly
help it to provide goods/services at a lower cost which in turn will enable it
to fix a lower price for its goods or services.
ü The following section discusses the different types of
efficiency and their impact on the operation of businesses and the definition
and scope of engineering economics.
.
Types of Efficiency
Efficiency of a
system is generally defined as the ratio of its output to input. The efficiency
can be classified into technical efficiency and economic efficiency.
1. Technical efficiency
It is the ratio of the output to input of a physical system. The
physical system may be a diesel engine, a machine working in a shop floor, a
furnace, etc.
Technical
efficiency (%) = Output/ Input × 100
The technical efficiency of a diesel engine is as follows:
Technical
efficiency (%) =
[ Heat
equivalent of mechanical energy produced / Heat equivalent of fuel used ] x 100
In practice, technical efficiency can never be more than 100%.
This is mainly due to frictional
loss and incomplete combustion of fuel, which are considered to be unavoidable
phenomena in the working of a diesel engine.
2. Economic efficiency
Economic efficiency is the ratio of output to input of a
business system.
Economic efficiency (%) = Output/Input × 100 = Worth/Cost × 100
‘Worth’ is the annual revenue generated by way of operating the business and ‘cost’ is the total annual expenses incurred in carrying out the
business.
For the survival and growth of any
business, the economic efficiency should be more than 100%.
Economic efficiency is also called ‘productivity’. There are several ways
of improving productivity.
§ Increased output for the same input
§ Decreased input for the same output
§ By a proportionate increase in the output which is more than the
proportionate increase in the input
§ By a proportionate decrease in the input which is more than the
proportionate decrease in the output
§ Through simultaneous increase in the output with decrease in the
input.
Definition and
Scope of Engineering Economics
As stated earlier, efficient functioning
of any business organization would enable it to provide goods/services at a
lower price.
In the process of managing
organizations, the managers at different levels should take appropriate
economic decisions which will help in minimizing investment, operating and
maintenance expenditures besides increasing the revenue, savings and other
related gains of the organization.
Definition
Engineering economics deals with the methods
that enable one to take economic decisions towards minimizing costs and/or
maximizing benefits to business organizations.
Scope
The issues that are covered in this
book are elementary economic analysis, interest formulae, bases for comparing
alternatives, present worth method, future worth method, annual equivalent
method, rate of return method, replacement analysis, depreciation, evaluation
of public alternatives, inflation adjusted investment decisions, make or buy
decisions, inventory control, project management, value engineering, and linear
programming.
Elements Of Costs
Cost can be broadly classified into variable
cost and overhead cost. Variable cost varies with the volume of
production while overhead cost is fixed, irrespective of the production volume.
Variable cost can be further
classified into direct material cost, direct labour cost, and direct expenses.
The overhead cost can be classified into factory overhead, administration
overhead, selling overhead, and distribution overhead.
Direct material costs are those
costs of materials that are used to produce the product. Direct labour cost is
the amount of wages paid to the direct labour involved in the production
activities.
Direct expenses are those expenses
that vary in relation to the production volume, other than the direct material
costs and direct labour costs.
Overhead cost is the aggregate of
indirect material costs, indirect labour costs and indirect expenses.
Administration overhead includes all the costs that are incurred in
administering the business.
Selling overhead is the total
expense that is incurred in the promotional activities and the expenses
relating to sales force. Distribution overhead is the total cost of shipping
the items from the factory site to the customer sites.
The selling price of a product is derived as shown below:
(a) Direct material costs + Direct
labour costs + Direct expenses = Prime cost
(b) Prime cost + Factory
overhead = Factory cost
(c) Factory cost
+ Office and
administrative overhead
= Costs of production
(d) Cost of production + Opening finished stock – Closing finished stock = Cost of
goods sold
(e)
Cost of goods sold + Selling and
distribution overhead = Cost of sales
(f) Cost of sales + Profit = Sales
(g) Sales/Quantity sold = Selling price per unit
In the above
calculations, if the opening finished stock is equal to the closing finished
stock, then the cost of production is equal to the cost of goods sold.
Other Costs/Revenues
The following are
the costs/revenues other than the costs which are presented in the previous
section:
ü Marginal cost
ü Marginal revenue
ü Sunk cost
ü Opportunity cost
1. Marginal Cost
Marginal cost of a
product is the cost of producing an additional unit of that product. Let the
cost of producing 20 units of a product be Rs. 10,000, and the cost of
producing 21 units of the same product be Rs. 10,045. Then the marginal cost of
producing the 21st unit is Rs. 45.
2. Marginal Revenue
Marginal revenue of
a product is the incremental revenue of selling an additional unit of that
product. Let, the revenue of selling 20 units of a product be Rs. 15,000 and
the revenue of selling 21 units of the same product be Rs. 15,085. Then, the
marginal revenue of selling the 21st unit is Rs. 85.
3. Sunk Cost
This is known as
the past cost of an equipment/asset. Let us assume that an equipment has been
purchased for Rs. 1,00,000 about three years back. If it is considered for
replacement, then its present value is not Rs. 1,00,000. Instead, its present
market value should be taken as the present value of the equipment for further
analysis.
So, the purchase
value of the equipment in the past is known as its sunk cost. The sunk cost
should not be considered for any analysis done from now onwards.
4. Opportunity Cost
In practice, if an
alternative (X ) is selected from a set of competing alternatives (X,Y
), then the corresponding investment in the selected alternative is not
available for any other purpose. If the same money is invested in some other
alternative (Y ), it may fetch some return. Since the money is invested
in the selected alternative (X ), one has to forego the return from the
other alternative (Y ).
The amount that is
foregone by not investing in the other alternative (Y ) is known as the
opportunity cost of the selected alternative (X ). So the opportunity
cost of an alternative is the return that will be foregone by not investing the
same money in another alternative.
Break-Even Analysis
The main objective of break-even
analysis is to find the cut-off production volume from where a firm will make
profit.
Let
s = selling price per unit v
= variable cost per unit FC
= fixed cost per period Q =
volume of production
The total sales revenue (S) of the firm is given by the
following formula:
S = s Q
The total cost of the firm for a
given production volume is given as
TC = Total variable cost + Fixed cost
= v Q + FC
·
The linear plots of the above two equations are
shown in Fig. .
·
The intersection point of the total sales revenue
line and the total cost line is called the
break-even point.
·
The corresponding volume of
production on the X-axis is known as the
break-even sales quantity.
·
At the intersection point, the total cost is equal
to the total revenue. This point is also called the no-loss or no-gain
situation.
·
For any production quantity which is less than the
break-even quantity, the total cost is more than the total revenue.
·
Hence, the firm will be making loss.
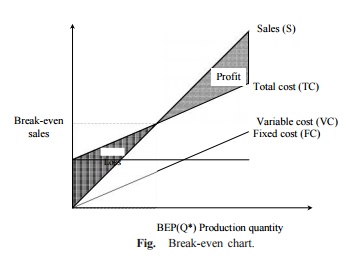
For any production
quantity which is more than the break-even quantity, the total revenue will be
more than the total cost. Hence, the firm will be making profit.
Profit = Sales – (Fixed cost + Variable costs)
= s Q – (FC + v Q)
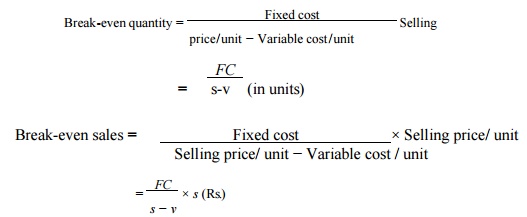
The formulae to find the break-even quantity and
break-even sales quantity
Break-even quantity = [ Fixed cost ] / [
price/unit − Variable cost/unit ] Selling
= FC/ s-v (in
units)
Break-even sales = [ Fixed cost × Selling price/ unit − Variable cost / unit ] x Selling price/
unit
= [ FC /
s − v ] × s (Rs.)
The contribution is
the difference between the sales and the variable costs. The margin of safety
(M.S.) is the sales over and above the break-even sales. The formulae to
compute these values are
Contribution = Sales – Variable costs
Contribution/unit =
Selling price/unit – Variable cost/unit
M.S. =
Actual sales – Break-even sales
= [ Profit / Contribution ] x sales
M.S. as a per cent of sales = (M.S./Sales) 100
P/V ratio is a valid ratio
which is useful for further analysis.
The different formulae for the P/V ratio are as
follows:
P/V ratio = Contribution
/ Sales = Sales − Variable
costs / Sales
The relationship between BEP and P/V
ratio is as follows:
BEP = Fixed
cost / P/V ratio
Elementary Economic Analysis
Whether it is a business situation
or a day-to-day event in somebody’s personal life, there are a large number of economic decision
making involved. One can manage many of these decision problems by using simple
economic analysis.
For example, an industry can source
its raw materials from a nearby place or from a far-off place. In this problem,
the following factors will affect the decision:
ü Price of the raw material
ü Transportation cost of the raw material
ü `Availability of the raw material
ü Quality of the raw material
Consider the alternative of sourcing
raw materials from a nearby place with the following characteristics:
ü The raw material is more costly in the nearby area.
ü The availability of the raw material is not sufficient enough to
support the operation of the industry throughout the year.
ü The raw material requires pre-processing before it is used in the production process. This would certainly
add cost to the product.
ü The cost of transportation is minimal under this
alternative.
On the other hand, consider another
alternative of sourcing the raw materials from a far-off place with the
following characteristics:
ü The raw material is less costly at the far off place.
ü The cost of transportation is very high.
ü The availability of the raw material at this site is abundant
and it can support the plant throughout the year.
ü The raw material
from this site
does not require
any pre processing before using it for production.
Material Selection For A
Product/Substitution Of Raw Material
The cost of a product can be reduced greatly by substitution of
the raw materials.
Among various elements of cost, raw material
cost is most significant and it forms a major portion of the total cost of any
product.
So, any attempt to find a suitable
raw material will bring a reduction in the total cost in any one or
combinations of the following ways:
ü Reduced machining/process time
ü Enhanced durability of the product
ü Cheaper raw material price
Therefore, the process of raw
material selection/substitution will result in finding an alternate raw
material which will provide the necessary functions that are provided by the
raw material that is presently used.
In this process, if the new raw
material provides any additional benefit, then it should be treated as its
welcoming feature. This concept is demonstrated with numerical problem given
below
Example
In the design of a jet engine part,
the designer has a choice of specifying either an aluminium alloy casting or a
steel casting. Either material will provide equal service, but the aluminium
casting will weigh 1.2 kg as compared with 1.35 kg for the steel casting.
The aluminium can be cast for Rs.
80.00 per kg. and the steel one for Rs. 35.00 per kg. The cost of machining per
unit is Rs. 150.00 for aluminium and Rs. 170.00 for steel. Every kilogram of
excess weight is associated with a penalty of Rs. 1,300 due to increased fuel
consumption. Which material should be specified and what is the economic
advantage of the selection per unit?
Solution (a) Cost of using aluminium metal for the jet engine
part:
Weight of aluminium casting/unit = 1.2 kg
Cost of making aluminium casting = Rs. 80.00 per kg
Cost of machining aluminium casting per unit = Rs. 150.00
Total cost of jet engine part made of aluminium/unit
= Cost of making aluminium casting/unit + Cost
of machining aluminium casting/unit
= 80 1.2 + 150 = 96 + 150
= Rs. 246
(b) Cost of jet engine part made of steel/unit:
Weight of steel casting/unit = 1.35 kg
Cost of making steel casting = Rs. 35.00 per kg
Cost of machining steel casting per unit = Rs.
170.00 Penalty of excess weight of steel casting = Rs. 1,300 per kg
Total cost of jet engine part made of steel/unit
= Cost of making steel casting/unit
+ Cost of machining steel casting/unit
+ Penalty for excess weight of steel
casting
= 35 1.35 + 170 +
1,300(1.35 – 1.2)
= Rs. 412.25
DECISION The total cost/unit of a jet engine part made of aluminium
is less than that for an engine made of steel. Hence, aluminium is suggested
for making the jet engine part. The economic advantage of using aluminium over
steel/unit is Rs.
412.25
– Rs. 246 = Rs. 166.25
i.Design Selection
for a Product
a. The design modification of a product may result in reduced raw
material requirements, increased machinability of the materials and reduced
labour.
b. Design is an important factor which decides the cost of the
product for a specified level of performance of that product.
Example
(Design selection for a process
industry). The chief engineer of refinery operations
is not satisfied with the preliminary design for storage tanks to be used as
part of a plant expansion programme. The engineer who submitted
the design was called in and asked to reconsider
the overall dimensions in the light of an article in the Chemical Engineer, entitled “How to size future
process vessels?”
The original design
submitted called for 4 tanks 5.2 m in diameter and 7 m in height. From a graph
of the article, the engineer found that the present ratio of height to diameter
of 1.35 is 111% of the minimum cost and that the minimum cost for a tank was
when the ratio of height to diameter was 4 : 1. The cost for the tank design as
originally submitted was estimated to be Rs. 9,00,000. What are the optimum
tank dimensions if the volume remains the same as for the original design? What
total savings may be expected through the redesign?
Solution
(a) Original design
Number of tanks = 4 Diameter of the tank = 5.2 m
Radius of the tank = 2.6 m Height of the tank = 7 m
Ratio of height to diameter = 7/5.2 = 1.35
Volume/tank = (22/7)r 2h = (22/7)(2.6)2 7
= 148.72 m3
(b) New design
Cost of the old design = 111% of the
cost of the new design (optimal design)
Optimal ratio of
the height to diameter = 4:1
h : d =
4 : 1
4d = h
d = h/4
r = h/8
Volume = (22/7)r2h
= 148.72 (since, the volume remains the same)
(22/7)(h/8)2h =
148.72
h = 14.47 m
r = h/8
= 14.47/8 = 1.81 m
Therefore,
Diameter of the new design = 1.81 2
= 3.62 m
Cost of the new design = 9,00,000 (100/111)
= Rs. 8,10,810.81
Expected savings by the redesign =
Rs. 9,00,000 – Rs. 8,10,810.81 = Rs. 89,189.19
Process Planning /Process
Modification
While planning for a new component,
a feasible sequence of operations with the least cost of processing is to be
considered.
The process sequence of a component
which has been planned in the past is not static.
It is always subject to modification
with a view to minimize the cost of manufacturing the component.
So, the objective of process
planning/process modification is to identify the most economical sequence of
operations to produce a component.
The steps in process planning are as follows:
1. Analyze the part drawing to get an overall picture of what is
required.
2. Make recommendations to or consult with product engineers on
product design changes.
3. List the basic operations required to produce the part to
the drawing or specifications.
4. Determine the most practical and economical manufacturing method
and the form or tooling required for each operation.
5. Devise the best way to combine the operations and put them in
sequence.
6. Specify the gauging required for the process.
Steps 3–5 aim to determine the most
practical and economical sequence of operations to produce a component. This
concept is demonstrated with a numerical problem.
Example
The process planning engineer of a
firm listed the sequences of operations as shown in Table to produce a
component.
Table Data for Example
Sequence
Process
sequence
1 Turning
– Milling – Shaping – Drilling
2 Turning
– Milling – Drilling
3 All
operations are performed with CNC machine
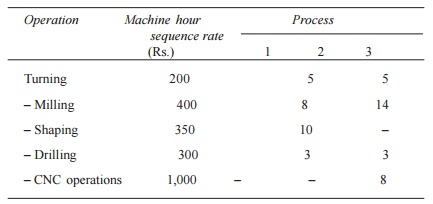
The details of processing times of
the component for various operations and their machine hour rates are
summarized in Table below
Machine Hour Rates and Processing
Times (minutes) for Example
Find the most
economical sequence of operations to manufacture the component.
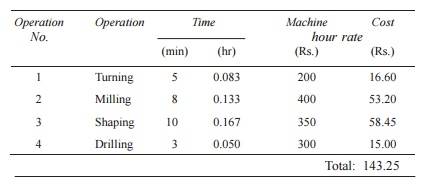
Solution (a) Cost of component using process sequence 1. The process sequence 1 of the component is as
follows:
Turning – Milling – Shaping – Drilling
The calculations for the cost of the above process sequence are
summarized in Table.
Table Workings for
Process Sequence 1
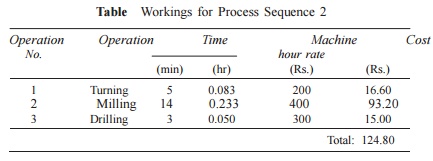
(b) Cost of
component using process sequence 2. The process
sequence 2 of the component is as follows:
Turning – Milling – Drilling
The calculations
for the cost of the above process sequence are given in Table
Table Workings for
Process Sequence 2
(c) Cost of
component using process sequence 3. The process
sequence 3 of the component is as follows:
Only CNC operations
The calculations
for the cost of the above process sequence are summarized in Table
Table Workings for Process Sequence 3
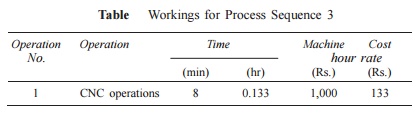
The process
sequence 2 has the least cost. Therefore, it should be selected for
manufacturing the component.
Related Topics