Chapter: Modern Analytical Chemistry: Obtaining and Preparing Samples for Analysis
How Much Sample to Collect
How Much Sample to Collect
To minimize sampling errors, a randomly collected grab sample
must be of an ap- propriate size. If the sample is too small
its composition may differ substantially from that of the target population, resulting in a significant sampling
error. Samples that are
too large, however, may require more
time and money
to collect and
ana- lyze, without providing a significant improvement in sampling error.
As a starting
point, letŌĆÖs assume
that our target
population consists of two types of
particles. Particles of type A contain analyte
at a fixed concentration, and type B particles contain no analyte.
If the two types of particles are randomly distributed, then a sample drawn
from the population will follow the
binomial distribution.* If we
collect a sample
containing n particles, the
expected number of particles con- taining analyte, nA, is
nA = np
where p is the probability of selecting a particle of type A. The sampling
standard deviation is
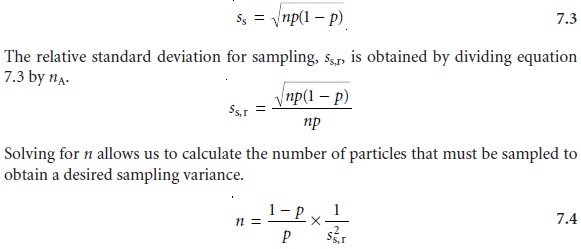
Note that the relative sampling
variance is inversely proportional to the number of particles sampled. Increasing the number of particles in a sample,
therefore, im- proves the sampling variance.
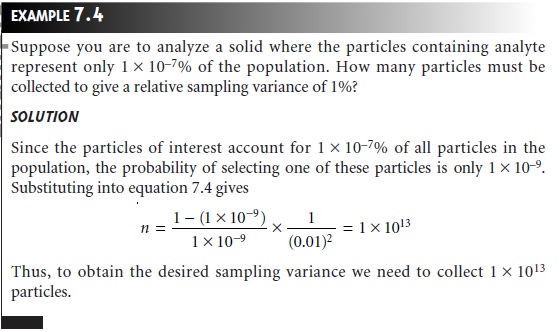
A sample containing 1013 particles can
be fairly large.
Suppose this is equivalent
to a mass of 80 g. Working
with a sample this large
is not practical; but does this
mean we must work with a smaller
sample and accept
a larger relative
sampling variance? Fortunately the
answer is no.
An important feature
of equation 7.4
is that the relative
sampling variance is a function
of the number of particles
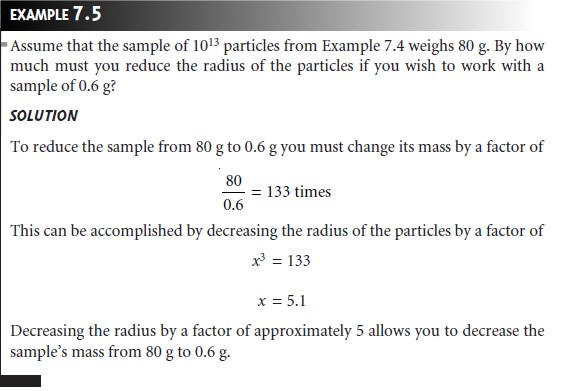
but not their combined mass. We can reduce
the needed mass by crushing
and grinding the par-
ticles to make them smaller.
Our sample must still contain
1013 particles, but since each particle
is smaller their
combined mass also is smaller.
If we assume that a par-
ticle is spherical, then its
mass is proportional to the cube
of its radius.
Mass ŌłØ r3
Decreasing a particleŌĆÖs radius by a factor of 2, for example,
decreases its mass by a fac- tor
of 23, or 8. Instead of an 80-g sample, a 10-g sample
will now contain
1013 particles.
Treating a population as though it contains only two types
of particles is a use- ful
exercise because it shows us that the relative sampling
variance can be improved
by collecting more particles of sample. Furthermore, we learned that the mass of
sample needed can
be reduced by decreasing particle size without affecting the rela- tive sampling variance. Both are
important conclusions.
Few populations, however, meet the conditions for a true
binomial distribu- tion. Real populations normally
contain more than two types of particles, with the analyte
present at several levels of concentration. Nevertheless, many well-mixed
populations, in which the populationŌĆÖs composition is homogeneous on the scale at
which we sample, approximate binomial sampling statistics. Under
these conditions the
following relationship between the mass of a randomly collected grab sample, m, and the
percent relative standard deviation for sampling, R, is
often valid.
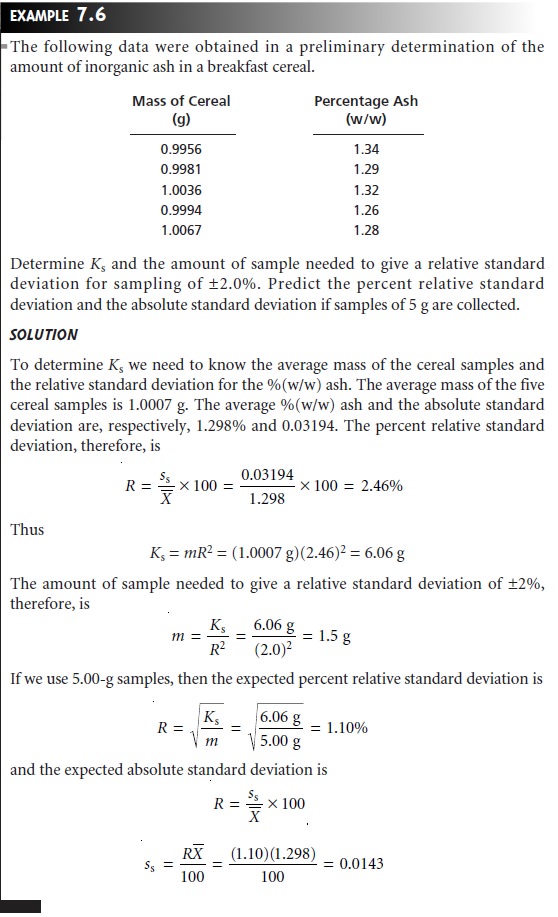
mR2 = Ks
where Ks is a sampling constant equal to the mass
of sample producing a percent relative
standard deviation for sampling of ┬▒1%.* The sampling constant is evalu- ated by determining R using
several samples of similar mass.
Once Ks is known,
the mass of sample
needed to achieve
a desired relative standard deviation for
sampling can be calculated.
When the target
population is segregated, or stratified, equation 7.5 provides a poor
estimate of the amount of sample needed to achieve
a desired relative
standard de- viation for sampling. A more appropriate relationship, which can be applied
to both segregated and nonsegregated samples,
has been proposed.
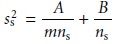 7.6
7.6
where ns is the number
of samples to be analyzed, m is the mass of each sample, A is a
homogeneity constant accounting for the random
distribution of analyte
in the target population,
and B is a segregation constant
accounting for the nonrandom
distribution of analyte
in the target population. Equation
7.6 shows that sampling
variance due to the random
distribution of analyte
can be minimized by increasing either the mass of each sample
or the total
number of samples. Sampling errors due to
the nonrandom distribution of the analyte,
however, can only be minimized by increasing the total number of samples. Values for the homogeneity constant
and heterogeneity constant are determined using
two sets of samples that differ signifi- cantly in mass.
Related Topics