Chapter: Power Quality : Harmonics
Harmonic Distortion Evaluation
Harmonic Distortion Evaluation:
The
interaction often gives rise to voltage and current harmonic distortion observed
in many places in the system. Therefore, to limit both voltage and current
harmonic distortion, IEEE Standard 519-19922 proposes to limit harmonic current
injection from end users so that harmonic voltage levels on the overall power
system will be acceptable if the power system does not inordinately accentuate
the harmonic currents. This approach requires participation from both end users
and utilities.1–3
1. End users. For individual end users, IEEE
Standard 519-1992 limits the level of harmonic current injection at the point of common coupling (PCC). This is
the quantity end users have control over. Recommended limits are provided for
both individual harmonic components and the total demand distortion. The
concept of PCC is illustrated in Fig. 4.25. These limits are expressed in terms
of a percentage of the end user’s maximum demand current level, rather than as
a percentage of the fundamental. This is intended to provide a common basis for
evaluation over time.
2. The utility. Since the harmonic voltage
distortion on the utility system arises from the interaction between distorted load currents and the utility system
impedance, the utility is mainly responsible for limiting the voltage
distortion at the PCC. The limits are given for the maximum individual harmonic
components and for the total harmonic distortion (THD). These values are
expressed as the percentage of the fundamental voltage. For systems below 69
kV, the THD should be less than 5 percent. Sometimes the utility system
impedance at harmonic frequencies is determined by the resonance of power
factor correction capacitor banks. This results in a very high impedance and
high harmonic voltages. Therefore, compliance with IEEE Standard 519-1992 often
means that the utility must ensure that system resonances do not coincide with
harmonic frequencies present in the load currents. Thus, in principle, end
users and utilities share responsibility for limiting harmonic current
injections and voltage distortion at the PCC. Since there are two parties
involved in limiting harmonic distortions, the evaluation of harmonic
distortion is divided into two parts: measurements of the currents being
injected by the load and calculations of the frequency response of the system
impedance. Measurements should be taken continuously over a sufficient period
of time so that time variations and statistical characteristics of the harmonic
distortion can be accurately represented. Sporadic measurements should be
avoided since they do not represent harmonic characteristics accurately given
that harmonics are a continuous phenomenon. The minimum measurement period is
usually 1 week since this provides a representative loading cycle for most
industrial and commercial loads.
1. Concept of point of common
coupling
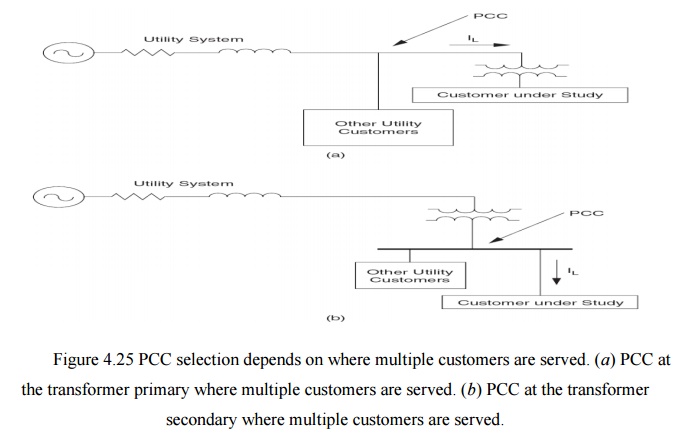
Evaluations
of harmonic distortion are usually performed at a point between the end user or
customer and the utility system where another customer can be served. This
point is known as the point of common coupling.1
The PCC
can be located at either the primary side or the secondary side of the service
transformer depending on whether or not multiple customers are supplied from
the transformer. In other words, if multiple customers are served from the
primary of the transformer, the PCC is then located at the primary. On the
other hand, if multiple customers are served from the secondary of the
transformer, the PCC is located at the secondary. Figure 4.25 illustrates these
two possibilities.
Note that
when the primary of the transformer is the PCC, current measurements for
verification can still be performed at the transformer secondary. The
measurement results should be referred to the transformer high side by the
turns ratio of the transformer, and the effect of transformer connection on the
zero-sequence components must be taken into account. For instance, a delta-wye
connected transformer will not allow zero-sequence current components to flow
from the secondary to the primary system. These secondary components will be
trapped in the primary delta winding. Therefore, zero-sequence components
(which are balanced triplen harmonic components) measured on the secondary side
would not be included in the evaluation for a PCC on the primary side.
2. Harmonic evaluations on the
utility system
Harmonic
evaluations on the utility system involve procedures to determine the
acceptability of the voltage distortion for all customers. Should the voltage
distortion exceed the recommended limits, corrective actions will be taken to
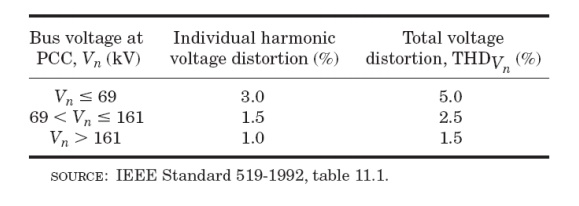
reduce the distortion to a level within limits. IEEE Standard 519-1992 provides
guidelines for acceptable levels of voltage distortion on the utility system.
These are summarized in Table 4.1. Note that the recommended limits are
specified for the maximum individual harmonic component and for the THD.
Note that
the definition of the total harmonic distortion in Table 4.1 is slightly
different than the conventional definition. The THD value in this table is
expressed as a function of the nominal system rms voltage rather than of the fundamental
frequency voltage magnitude at the time of the measurement. The definition used
here allows the evaluation of the voltage distortion with respect to fixed
limits rather than limits that fluctuate with the system voltage. A similar
concept is applied for the current limits.
There are
two important components for limiting voltage distortion levels on the overall
utility system:
1. Harmonic
currents injected from individual end users on the system must be limited.
These currents propagate toward the supply source through the system impedance,
creating voltage distortion. Thus by limiting the amount of injected harmonic
currents, the voltage distortion can be limited as well. This is indeed the
basic method of controlling the overall distortion levels proposed by IEEE
Standard 519- 1992.
2. The
overall voltage distortion levels can be excessively high even if the harmonic
current injections are within limits. This condition occurs primarily when one
of the harmonic current frequencies is close to a system resonance frequency.
This can result in unacceptable voltage distortion levels at some system
locations. The highest voltage distortion will generally occur at a capacitor
bank that participates in the resonance. This location can be remote from the
point of injection.
Table 4.1
Harmonic Voltage Distortion Limits in Percent of
Nominal Fundamental Frequency
Voltage
3. Voltage limits evaluation
procedure:
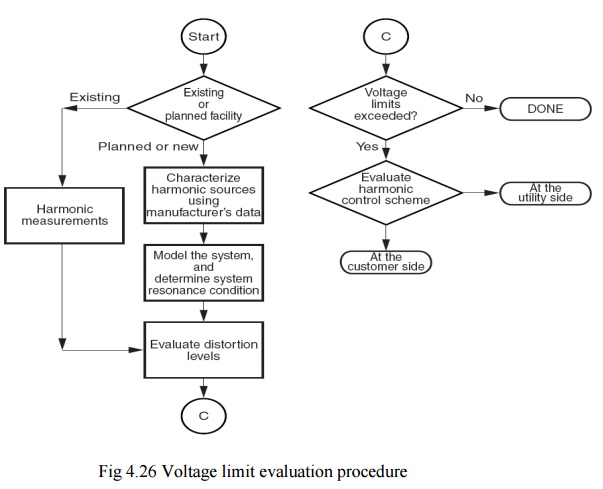
The
overall procedure for utility system harmonic evaluation is described here.
This procedure is applicable to both existing and planned installations. Figure
4.26 shows a flowchart of the evaluation procedure.
1.
Characterization of harmonic sources. Characteristics
of harmonic sources on the system are best determined with
measurements for existing installations. These measurements should be performed
at facilities suspected of having offending nonlinear loads. The duration of
measurements is usually at least 1 week so that all the cyclical load
variations can be captured. For new or planned installations, harmonic
characteristics provided by manufacturers may suffice.
2.
System
modeling. The
system response to the harmonic currents injected at end-user locations or by nonlinear devices on
the power system is determined by developing a computer model of the system.
3.
System
frequency response. Possible system resonances should
be determined by a frequency scan of
the entire power delivery system. Frequency scans are performed for all
capacitor bank configurations of interest since capacitor configuration is the
main variable that will affect the resonant frequencies.
Evaluate
expected distortion levels. Even with system resonance close
to characteristic harmonics, the voltage distortion levels around the system may
be acceptable. On distribution systems, most resonances are significantly
damped by the resistances on the system, which reduces magnification of the
harmonic currents. The estimated harmonic sources are used with the system
configuration yielding the worst-case frequency-response characteristics to
compute the highest expected harmonic distortion. This will indicate whether or
not harmonic mitigation measures are necessary.
5. Evaluate harmonic control scheme. Harmonic control options consist
of controlling the harmonic
injection from nonlinear loads, changing the system frequency-response
characteristics, or blocking the flow of harmonic currents by applying harmonic
filters. Design of Passive filters for some systems can be difficult because
the system characteristics are constantly changing as loads vary and capacitor
banks are switched.
4. Harmonic evaluation for
end-user facilities:
Harmonic
problems are more common at end-user facilities than on the utility supply
system. Most nonlinear loads are located within end-user facilities, and the
highest voltage distortion levels occur close to harmonic sources. The most
significant problems occur when there are nonlinear loads and power factor
correction capacitors that result in resonant conditions. IEEE Standard
519-1992 establishes harmonic current distortion limits at the PCC. The limits,
summarized in Table 4.2, are dependent on the customer load in relation to the
system short-circuit capacity at the PCC.
The
variables and additional restrictions to the limits given in Table 4.2 are:
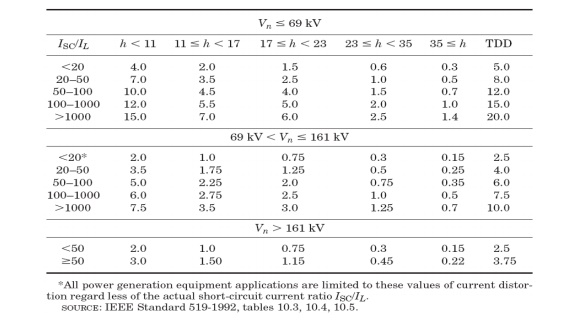
ü Ih is the
magnitude of individual harmonic components (rms amps).
ü ISC is the short-circuit current
at the PCC.
ü IL is the fundamental component of
the maximum demand load current at the PCC. It can be calculated as the average of the maximum monthly demand
currents for the previous 12 months or it may have to be estimated.
ü The
individual harmonic component limits apply to the odd-harmonic components.
Even-harmonic components are limited to 25 percent of the limits.
ü Current
distortion which results in a dc offset at the PCC is not allowed.
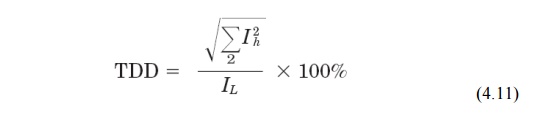
ü The total
demand distortion (TDD) is expressed in terms of the maximum demand load
current, i.e.,
ü If the
harmonic-producing loads consist of power converters with pulse number q higher than 6, the limits indicated in
Table 6.2 are increased by a factor equal to √ q/6 .
In
computing the short-circuit current at the PCC, the normal system conditions
that result in minimum short-circuit capacity at the PCC should be used since
this condition results in the most severe system impacts.
A
procedure to determine the short-circuit ratio is as follows:
ü Determine
the three-phase short-circuits duty ISC
at the PCC. This value may be obtained directly from the utility and expressed
in amperes. If the short-circuit duty is given in mega volt amperes, convert it
to an amperage value using the following expression:

ü Find the
load average kilowatt demand PD
over the most recent 12months. This can be found from billing information.
ü Convert the average kilowatt demand to the average demand currentin amperes using the following expression:
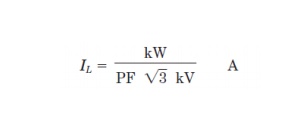
where PF is the average billed power factor.
ü The short-circuit ratio is now determined by:
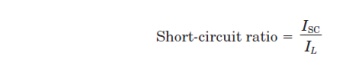
This is
the short-circuit ratio used to determine the limits on harmonic currents in
IEEE Standard 519-1992.
In some
instances, the average of the maximum demand load current at the PCC for the
previous 12 months is not available. In such circumstances, this value must be
estimated based on the predicted load profiles. For seasonal loads, the average
should be over the maximum loads only.
Related Topics