Chapter: 9th Science : Motion
Graphical Representation of Motion along a Straight Line
Graphical Representation of Motion along a Straight Line
Plotting the distance/displacement or
speed/velocity on a graph helps us visually understand certain things about
time and position.
1. The distance – time graph for uniform motion
The following Table shows the distance walked by
Surya at different times.
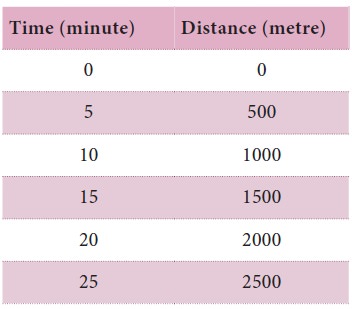
A graph is drawn by taking time along X-axis and
distance along Y-axis. The graph is known as distance – time graph. When we
look at the distance – time graph of Surya’s walk, we notice certain things.
First, it is a straight line. We also notice that Surya covers equal distances
in
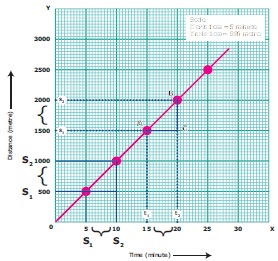
We can therefore conclude
that Surya walked at a constant speed. Can you find the speed at which Surya
walked, from the graph? Yes, you can. The parameter is referred to as the slope
of the line.
Speed at which Surya walked = distance covered /
time taken = BC/AC (From the graph)
= slope of
the straight line
= 500 / 5 =
100 ms-1
Steeper the slope (in other words the larger value)
the greater is the speed.
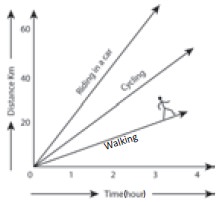
Let us take a look at the distance–time graphs of
three different people – Surya walking, Monica cycling and Hari going in a car,
along the same path. We know that cycling can be faster than walking and a car
can go faster than a cycle. The distance – time graph of the three would be as
given in the following graph. The slope of the line on the distance – time
graph becomes steeper and steeper as the speed increases.
2. The distance time graph for non uniform motion
We can also plot the distance – time graph for
accelerated motion (non uniform motion). Table given below shows the distance
travelled by a car in a time interval of two second.
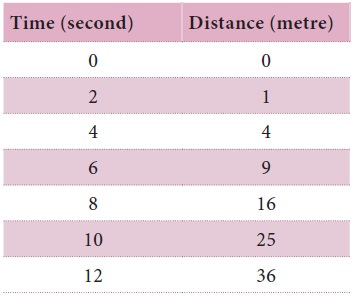
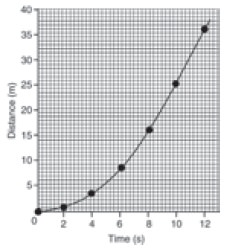
Note that the graph is not a straight line as we
got in the case of uniform motion. is nature of the graph shows non – linear
variation of the distance travelled by the car with time. us, the graph
represents motion with non uniform speed.
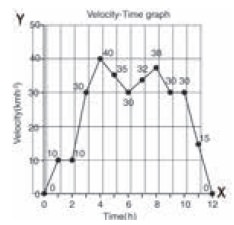
3. Velocity – Time graph
The variation in velocity of an object with time
can be represented by velocity – time graph. In the graph, time is represented
along the X – axis and the velocity is represented along the Y – axis. If the
object moves at uniform velocity, a straight line parallel to X-axis is obtained. is Graph shows the velocity –
time graph for a car moving with uniform velocity of 40 km/hour.
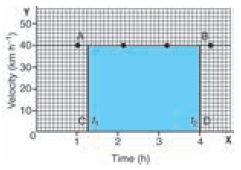
We know that the product of velocity and time gives
displacement of an object moving with uniform velocity.
The area under the velocity – time graph is equal
to the magnitude of the displacement.
So the distance (displacement) S covered by the car
in a time interval of t can be expressed as
S = AC × CD
S = Area of the rectangle ABCD (shaded portion in
the graph)
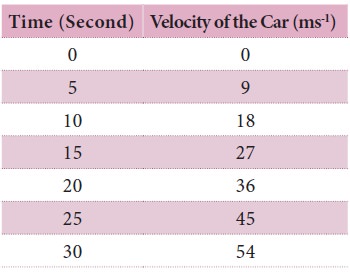
We can also study about uniformly accelerated
motion by plotting its velocity – time graph. Consider a car being driven along
a straight road for testing its engine. Suppose a person sitting next to the
driver records its velocity for every 5 seconds from the speedometer of the car.
The velocity of the car in ms-1 at different instants of time is shown in the
Table below.
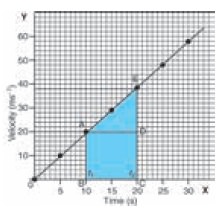
In this case, the velocity – time graph for the
motion of the car is shown in graph (straight line). The nature of the graph
shows that the velocity changes by equal amounts in equal intervals of time.
Thus, for all uniformly accelerated motion, the velocity – time graph is a
straight line.
One can also determine the distance moved by the
car from its velocity – time graph. The area under the velocity – time graph
gives the distance (magnitude of displacement) moved by the car in a given
interval of time.
Since the magnitude of the velocity of the car is
changing due to acceleration, the distance S travelled by the car will be given
by the area ABCDE under the velocity – time graph. That is
S = area ABCDE
= area of
the rectangle ABCD + area of the triangle ADE
S = (AB × BC) + ½ (AD × DE)
The area ABCDE can also be calculated by
considering the shape as trapezium. Area of the quadrangle ABCDE can also be
calculated by calculating the area of trapezium ABCDE. It means
S = area of trapezium ABCDE
= ½ × sum of
length of parallel sides × distance between parallel sides
S = ½ × (AB + CE) × BC
In the case of non uniformly accelerated motion,
distance – time graph, velocity – time graphs can have any shape as shown in
Figure below:
Related Topics