Chapter: Medical Surgical Nursing: Assessment of Cardiovascular Function
Function of the Heart: Conduction System
FUNCTION OF THE HEART: CONDUCTION SYSTEM
The
specialized heart cells of the cardiac
conduction system me-thodically generate and coordinate the transmission of
electrical impulses to the myocardial cells. The result is sequential
atrio-ventricular contraction, which provides for the most effective flow of
blood, thereby optimizing cardiac output. Three physio-logic characteristics of
the cardiac conduction cells account for this coordination:
Automaticity: ability
to initiate an electrical impulse
Excitability: ability
to respond to an electrical impulse
Conductivity: ability
to transmit an electrical impulse from onecell to another
The
sinoatrial (SA) node, referred to as
the primary pace-maker of the heart, is located at the junction of the superior
vena cava and the right atrium (Fig. 26-3). The SA node in a normal resting
heart has an inherent firing rate of 60 to 100 impulses per minute, but the
rate can change in response to the metabolic de-mands of the body.
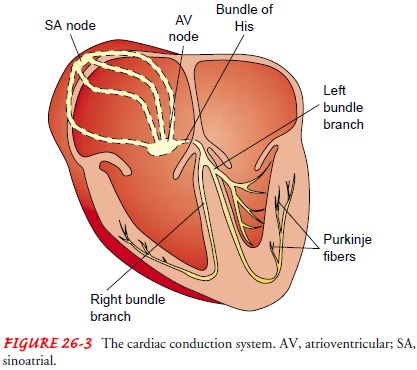
The electrical impulses initiated by the SA node are conducted along the myocardial cells of the atria via specialized tracts called internodal pathways. The impulses cause electrical stimulation and subsequent contraction of the atria.
The impulses are then conducted to the
atrioventricular (AV) node. The AV node (lo-cated in the right atrial wall near
the tricuspid valve) consists of another group of specialized muscle cells
similar to those of the SA node. The AV node coordinates the incoming
electrical im-pulses from the atria and, after a slight delay (allowing the
atria time to contract and complete ventricular filling), relays the impulse to
the ventricles. This impulse is then conducted through a bun-dle of specialized
conduction cells (bundle of His) that travel in the septum separating the left and
right ventricles. The bundle of His divides into the right bundle branch
(conducting impulses to the right ventricle) and the left bundle branch
(conducting im-pulses to the left ventricle). To transmit impulses to the
largest chamber of the heart, the left bundle branch bifurcates into the left
anterior and left posterior bundle branches. Impulses travel through the bundle
branches to reach the terminal point in the conduction system, called the
Purkinje fibers. This is the point at which the myocardial cells are
stimulated, causing ventricular contraction.
The
heart rate is determined by the myocardial cells with the fastest inherent
firing rate. Under normal circumstances, the SA node has the highest inherent
rate, the AV node has the second-highest inherent rate (40 to 60 impulses per
minute), and the ventricular pacemaker sites have the lowest inherent rate (30
to 40 impulses per minute). If the SA node malfunctions, the AV node generally
takes over the pacemaker function of the heart at its inherently lower rate.
Should both the SA and the AV nodes fail in their pacemaker function, a
pacemaker site in the ventricle will fire at its inherent bradycardic rate of
30 to 40 impulses per minute.
Physiology of Cardiac Conduction
Cardiac
electrical activity is the result of the movement of ions (charged particles
such as sodium, potassium, and calcium) across the cell membrane. The
electrical changes recorded within a single cell result in what is known as the
cardiac action potential (Fig. 26-4).
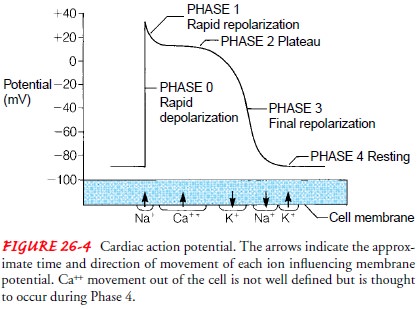
In the resting state, cardiac muscle cells are polarized, which means an electrical difference exists between the negatively charged inside and the positively charged outside of the cell membrane.
As
soon as an electrical impulse is initiated, cell membrane per-meability changes
and sodium moves rapidly into the cell, while potassium exits the cell. This
ionic exchange begins depolariza-tion (electrical
activation of the cell), converting the internalcharge of the cell to a
positive one (see Fig. 26-4). Contraction of the myocardium follows
depolarization. The interaction between changes in membrane voltage and muscle
contraction is called electromechanical coupling. As one cardiac muscle cell is
depo-larized, it acts as a stimulus to its neighboring cell, causing it to
depolarize. Sufficient depolarization of a single specialized con-duction
system cell results in depolarization and contraction of the entire myocardium.
Repolarization (return of the cell
to its resting state) occurs as the cell returns to its baseline or resting
state; this corresponds to relaxation of myocardial muscle.
After
the rapid influx of sodium into the cell during depolariza-tion, the
permeability of the cell membrane to calcium is changed. Calcium enters the
cell and is released from intracellular calcium stores. The increase in
calcium, which occurs during the plateau phase of repolarization, is much
slower than that of sodium and continues for a longer period.
Cardiac
muscle, unlike skeletal or smooth muscle, has a pro-longed refractory period
during which it cannot be restimulated to contract. There are two phases of the
refractory period, referred to as the absolute refractory period and the
relative refractory pe-riod. The absolute refractory period is the time during
which the heart cannot be restimulated to contract regardless of the strength
of the electrical stimulus. This period corresponds with depolar-ization and
the early part of repolarization. During the latter part of repolarization,
however, if the electrical stimulus is stronger than normal, the myocardium can
be stimulated to contract. This short period at the end of repolarization is
called the relative re-fractory period.
Refractoriness
protects the heart from sustained contraction (tetany), which would result in
sudden cardiac death. Normal electromechanical coupling and contraction of the
heart depend on the composition of the interstitial fluid surrounding the heart
muscle cells. In turn, the composition of this fluid is influenced by the
composition of the blood. A change in serum calcium concentration may alter the
contraction of the heart muscle fibers. A change in serum potassium
concentration is also im-portant, because potassium affects the normal
electrical voltage of the cell.
Cardiac Hemodynamics
An
important determinant of blood flow in the cardiovascular sys-tem is the
principle that fluid flows from a region of higher pres-sure to one of lower
pressure. The pressures responsible for blood flow in the normal circulation
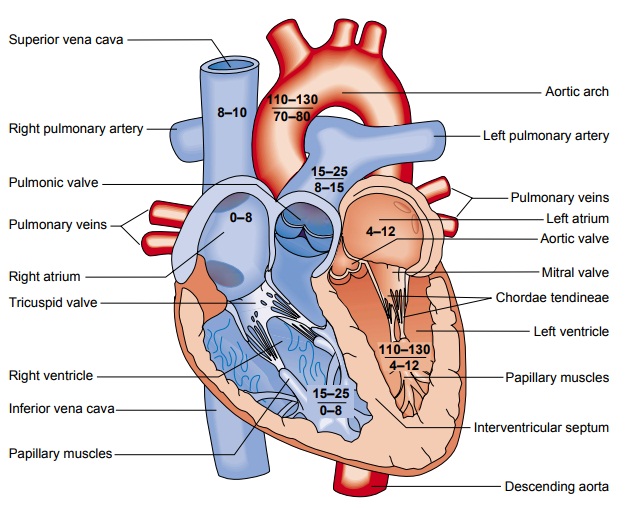
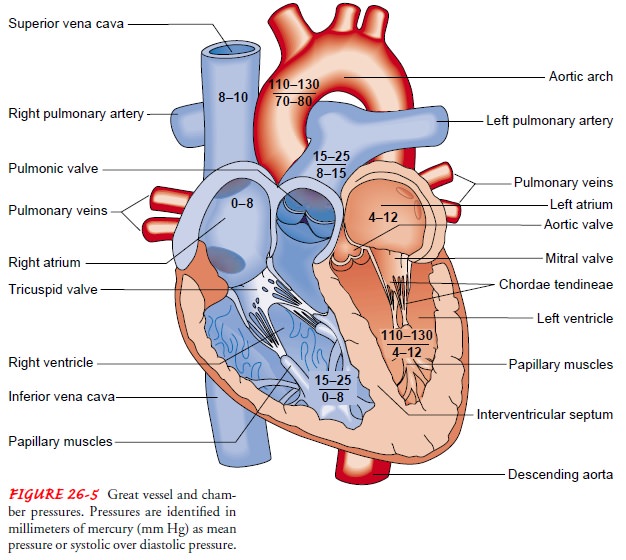
are generated during systole and di-astole. Figure 26-5 depicts the pressure
differences in the great ves-sels and in the four chambers of the heart during
systole and diastole.
CARDIAC CYCLE
Beginning with systole, the pressure inside the ventricles rapidly rises, forcing the atrioventricular valves to close. As a result, blood ceases to flow from the atria into the ventricles and regurgitation (backflow) of blood into the atria is prevented. The rapid rise of pressure inside the right and left ventricles forces the pulmonic and aortic valves to open, and blood is ejected into the pulmonary artery and aorta, respectively. The exit of blood is at first rapid; then, as the pressure in each ventricle and its corresponding artery equalizes, the flow of blood gradually decreases. At the end of systole, pressure within the right and left ventricles rapidly de-creases. This lowers pulmonary artery and aortic pressure, causing closure of the semilunar valves. These events mark the onset of diastole.
During
diastole, when the ventricles are relaxed and the atrio-ventricular valves are
open, blood returning from the veins flows into the atria and then into the
ventricles. Toward the end of this diastolic period, the atrial muscles
contract in response to an electrical impulse initiated by the SA node (atrial
systole). The resultant contraction raises the pressure inside the atria,
ejecting blood into the ventricles. Atrial systole augments ventricular blood volume
by 15% to 25% and is sometimes referred to as the “atrial kick.” At this point,
ventricular systole begins in response to propagation of the electrical impulse
that began in the SA node some milliseconds previously. The following section
reviews the chamber pressures generated during systole and diastole.
Chamber Pressures.
In
the right side of the heart, the pressuregenerated during ventricular systole
(15 to 25 mm Hg) exceeds the pulmonary artery diastolic pressure (8 to 15 mm
Hg), and blood is ejected into the pulmonary circulation. During diastole,
venous blood flows into the atrium because pressure in the supe-rior and
inferior vena cava (8 to 10 mm Hg) is higher than that in the atrium. Blood
flows through the open tricuspid valve and into the
right ventricle until the two right chamber pressures equalize (0 to 8 mm Hg).
In
the left side of the heart, similar events occur, although higher pressures are
generated. As pressure mounts in the left ven-tricle during systole (110 to 130
mm Hg), resting aortic pressure (80 mm Hg) is exceeded and blood is ejected
into the aorta. Dur-ing left ventricular ejection, the resultant aortic
pressure (110 to 130 mm Hg) forces blood progressively through the arteries.
For-ward blood flow into the aorta ceases as the ventricle relaxes and pressure
drops. During diastole, oxygenated blood returning from the pulmonary
circulation via the four pulmonary veins flows into the atrium, where pressure
remains low. Blood readily flows into the left ventricle because ventricular
pressure is also low. At the end of diastole, pressure in the atrium and
ventricle equilibrates (4 to 12 mm Hg). Figure 26-5 depicts the systolic and
diastolic pressures in the four chambers of the heart.
Pressure Measurement. Chamber
pressures are measured withthe use of special monitoring catheters and
equipment. This technique is called hemodynamic monitoring. Nurses caring for
critically ill patients must have a sophisticated working knowl-edge of normal
chamber pressures and the hemodynamic changes that occur during serious
illnesses. The data obtained from hemo-dynamic monitoring assist with the
diagnosis and management of pathophysiologic conditions affecting critically
ill patients.
Cardiac Output
Cardiac output is
the amount of blood pumped by each ventri-cle during a given period. The
cardiac output in a resting adult is about 5 L per minute but varies greatly
depending on the meta-bolic needs of the body. Cardiac output is computed by
multi-plying the stroke volume by the heart rate. Stroke volume is the amount of blood ejected per heartbeat. The
average resting stroke volume is about 70 mL, and the heart rate is 60 to 80
beats per minute (bpm). Cardiac output can be affected by changes in either
stroke volume or heart rate.
CONTROL OF HEART RATE
Cardiac
output must be responsive to changes in the metabolic demands of the tissues.
For example, during exercise the total car-diac output may increase fourfold,
to 20 L per minute. This in-crease is normally accomplished by approximate
doubling of both the heart rate and the stroke volume. Changes in heart rate
are ac-complished by reflex controls mediated by the autonomic ner-vous system,
including its sympathetic and parasympathetic divisions. The parasympathetic
impulses, which travel to the heart through the vagus nerve, can slow the
cardiac rate, whereas sym-pathetic impulses increase it. These effects on heart
rate result from action on the SA node, to either decrease or increase its
in-herent rate. The balance between these two reflex control systems normally
determines the heart rate. The heart rate is stimulated also by an increased
level of circulating catecholamines (secreted by the adrenal gland) and by
excess thyroid hormone, which pro-duces a catecholamine-like effect.
Heart
rate is also affected by central nervous system and baro-receptor activity. Baroreceptors are specialized nerve
cells located in the aortic arch and in both right and left internal carotid
arteries (at the point of bifurcation from the common carotid ar-teries). The baroreceptors
are sensitive to changes in blood pres-sure (BP). During elevations in BP (hypertension), these cells increase
their rate of discharge, transmitting impulses to the medulla. This initiates
parasympathetic activity and inhibits sym-pathetic response, lowering the heart
rate and the BP. The oppo-site is true during hypotension (low BP). Hypotension results in less baroreceptor
stimulation, which prompts a decrease in parasympathetic inhibitory activity in
the SA node, allowing for enhanced sympathetic activity. The resultant
vasoconstriction and increased heart rate elevate the BP.
CONTROL OF STROKE VOLUME
Stroke
volume is primarily determined by three factors: preload, afterload, and
contractility.
Preload is the
term used to describe the degree of stretch ofthe cardiac muscle fibers at the
end of diastole. The end of dias-tole is the period when filling volume in the
ventricles is the high-est and the degree of stretch on the muscle fibers is
the greatest. The volume of blood within the ventricle at the end of diastole
determines preload. Preload has a direct effect on stroke volume. As the volume
of blood returning to the heart increases, muscle fiber stretch also increases
(increased preload), resulting in stronger contraction and a greater stroke
volume. This relationship, called the Frank-Starling law of the heart (or
sometimes the Starling law of the heart), is maintained until the physiologic
limit of the mus-cle is reached.
The
Frank-Starling law is based on the fact that, within lim-its, the greater the
initial length or stretch of the cardiac muscle cells (sarcomeres), the greater
the degree of shortening that oc-curs. This result is caused by increased
interaction between the thick and thin filaments within the cardiac muscle
cells. Preload is decreased by a reduction in the volume of blood returning to
the ventricles. Diuresis, venodilating
agents (eg, nitrates), and loss of blood or body fluids from excessive
diaphoresis, vomiting, or diarrhea reduce preload. Preload is increased by increasing
the return of circulating blood volume to the ventricles. Controlling the loss
of blood or body fluids and replacing fluids (ie, blood transfusions and
intravenous fluid administration) are examples of ways to increase preload.
The
second determinant of stroke volume is afterload,
the amount of resistance to ejection of blood from the ventricle. The
resistance of the systemic BP to left ventricular ejection is called systemic vascular resistance. The
resistance of the pulmonaryBP to right ventricular ejection is called pulmonary vascular re-sistance. There
is an inverse relationship between afterload andstroke volume. For example,
afterload is increased by arterial vaso-constriction, which leads to decreased
stroke volume. The oppo-site is true with arterial vasodilation: afterload is
reduced because there is less resistance to ejection, and stroke volume
increases.
Contractility is
a term used to denote the force generated bythe contracting myocardium under
any given condition. Con-tractility is enhanced by circulating catecholamines,
sympathetic neuronal activity, and certain medications (eg, digoxin,
intra-venous dopamine or dobutamine). Increased contractility results in
increased stroke volume. Contractility is depressed by hy-poxemia, acidosis,
and certain medications (eg, beta-adrenergic blocking agents such as atenolol
[Tenormin]).
The
heart can achieve a greatly increased stroke volume (eg, during exercise) by
increasing preload (through increased venous return), increasing contractility
(through sympathetic nervous system discharge), and decreasing afterload
(through peripheral vasodilation with decreased aortic pressure).
The
percentage of the end-diastolic volume that is ejected with each stroke is
called the ejection fraction. With
each stroke, about 42% (right ventricle) to 50% (left ventricle) or more of the
end-diastolic volume is ejected by the normal heart. The ejection fraction can
be used as an index of myocardial contractility: the ejection fraction
decreases if contractility is depressed.
Gerontologic Considerations
Changes
in cardiac structure and function are clearly observable in the older heart. To
understand the changes specifically related to aging, it is helpful to
distinguish the normal aging process from changes related to CVD. The anatomic
and functional changes in the aging heart are listed in Table 26-1.
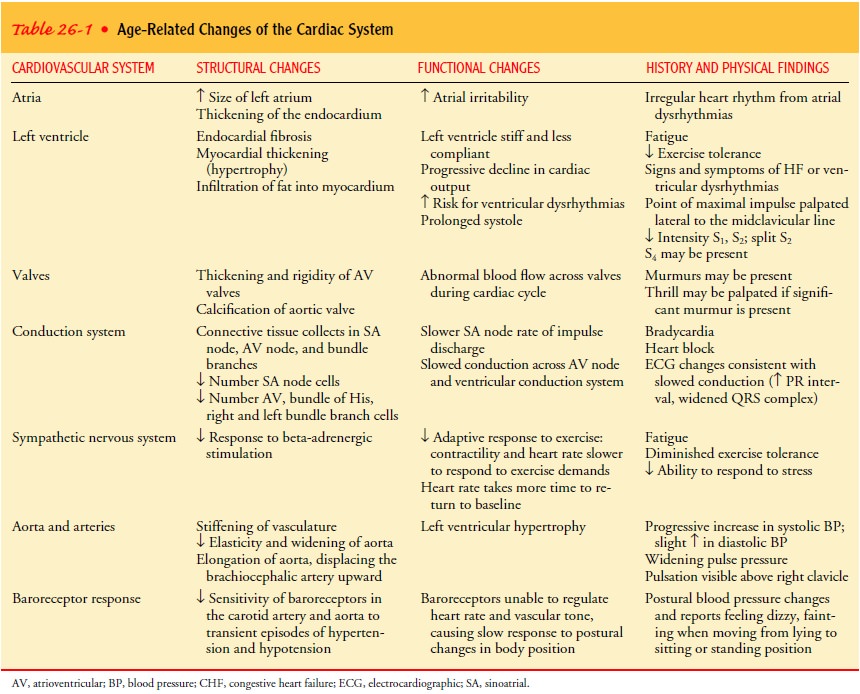
Studies
show that the normal aging heart can produce ade-quate cardiac output under
ordinary circumstances but may have a limited ability to respond to situations
that cause physical or emotional stress. In an elderly person who is less
active, the left ventricle may become smaller (atrophy) as a consequence of
phys-ical deconditioning. Aging also results in decreased elasticity and
widening of the aorta, thickening and rigidity of the cardiac valves, and
increased connective tissue in the SA and AV nodes and bundle branches.
These changes lead to decreased myocardial contractility, in-creased left ventricular ejection time (prolonged systole), and de-layed conduction. Therefore, stressful physical and emotional conditions, especially those that occur suddenly, may have ad-verse effects on the aged person. The heart cannot respond to such conditions with an adequate rate increase and needs more time to return to a normal resting rate after even a minimal in-crease in heart rate. In some patients, the added stress may pre-cipitate heart failure (HF).
Related Topics