Chapter: Medical Physiology: The Normal Electrocardiogram
Flow of Current Around the Heart During the Cardiac Cycle
Flow of Current Around the Heart During the Cardiac Cycle
Recording Electrical Potentials from a Partially Depolarized Mass of Syncytial Cardiac Muscle
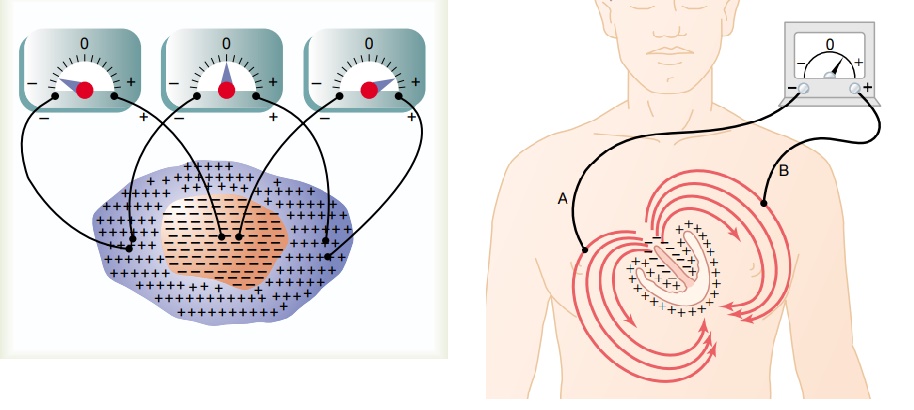
Figure 11–4 shows a syncytial mass of cardiac muscle that has been stimulated at its centralmost point.
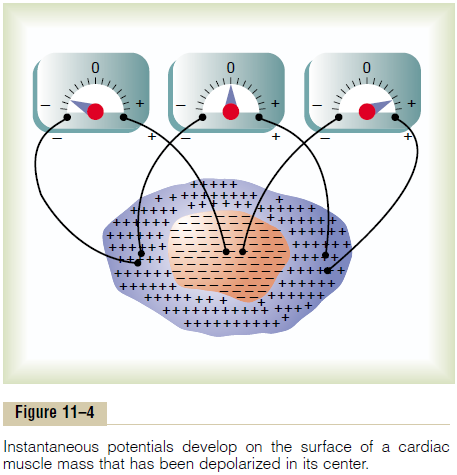
Before stimulation, all the exteriors of the muscle cells had been positive and the interiors negative. For reasons presented in the discussion of membrane potentials, as soon as an area of cardiac syncytium becomes depolarized, negative charges leak to the outsides of the depolarized muscle fibers, making this part of the surface electronegative, as rep-resented by the negative signs in Figure 11–4. The remaining surface of the heart, which is still polarized, is represented by the positive signs. Therefore, a meter connected with its negative terminal on the area of depolarization and its positive terminal on one of the still-polarized areas, as shown to the right in the figure, records positively.
Two other electrode placements and meter readings are also demonstrated in Figure 11–4. These should bestudied carefully, and the reader should be able to explain the causes of the respective meter readings.
Because the depolarization spreads in all directions through the heart, the potential differences shown in the figure persist for only a few thousandths of a second, and the actual voltage measurements can be accomplished only with a high-speed recording apparatus.
Flow of Electrical Currents in the Chest Around the Heart
Figure 11–5 shows the ventricular muscle lying within the chest. Even the lungs, although mostly filled with air, conduct electricity to a surprising extent, and fluids in other tissues surrounding the heart conduct electricity even more easily. Therefore, the heart is actually suspended in a conductive medium.
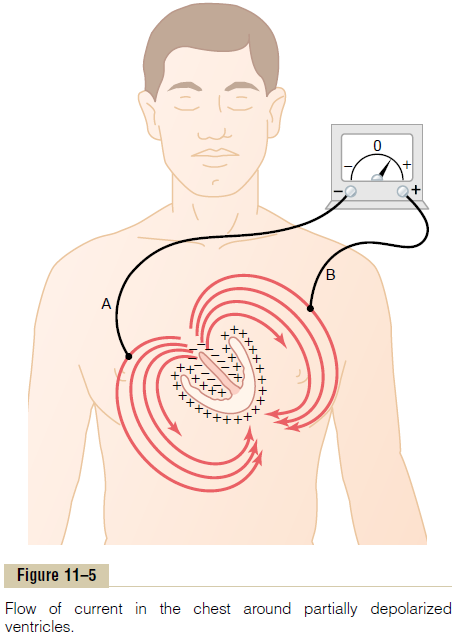
When one portion of the ventricles depolarizes and therefore becomes electronegative with respect to the remainder, electrical current flows from the depolar-ized area to the polarized area in large circuitous routes, as noted in the figure.
It should be recalled from the discussion of the Purkinje system that the cardiac impulse first arrives in the ventricles in the septum and shortly thereafter spreads to the inside surfaces of the remain-der of the ventricles, as shown by the red areas and the negative signs in Figure 11–5. This provides elec-tronegativity on the insides of the ventricles and elec-tropositivity on the outer walls of the ventricles, with electrical current flowing through the fluids surround-ing the ventricles along elliptical paths, as demon-strated by the curving arrows in the figure. If one algebraically averages all the lines of current flow (the elliptical lines), one finds that the average current flow occurs with negativity toward the base of the heart and with positivity toward the apex.
During most of the remainder of the depolarization process, current also continues to flow in this same direction, while depolarization spreads from the endo-cardial surface outward through the ventricular muscle mass. Then, immediately before depolarization has completed its course through the ventricles, the average direction of current flow reverses for about 0.01 second, flowing from the ventricular apex toward the base, because the last part of the heart to become depolarized is the outer walls of the ventricles near the base of the heart.
Thus, in normal heart ventricles, current flows from negative to positive primarily in the direction from the base of the heart toward the apex during almost the entire cycle of depolarization, except at the very end. And if a meter is connected to electrodes on the surface of the body as shown in Figure 11–5, the electrode nearer the base will be negative, whereas the electrode nearer the apex will be positive, and the recording meter will show positive recording in the electrocardiogram.
Related Topics