Chapter: Business Science : Financial Management
Financial Management - Tutorial Problems and Worked out Problems
Tutorial Problems And Worked Out Problems
1. Simple Interest
Illustration: 1
If you invest Rs 10,000 (P0) in a bank at simple interest of 7% (i) per annum, what will be the amount at the end of three (n) years?
Solution
Future Value, FVn = P0 + SI = P0 + P0(i)(n) = 10,000 + 10,000(0.07)(3) = 12,100
Illustration 2:
2,000 (P0) is deposited in a bank for two (n) years at simple interest of 6% (i). How much will be the balance at the end of 2 years?
Solution
Required balance is given by
FVn = P0 + P0(i)(n) = 2,000 + 2000 (0.06)( 2) = 2,000 + 240 = ` 2,240.
Illustration 3:
Find the rate of interest if the amount owed after 6 (n) months is ` 1,050 (A), borrowed amount being ` 1,000 (P0).
Solution
We know
FVn = P0 + P0(i)(n)
i.e. 1,050 = 1,000 + 1,000(i)(6/12) Or 1,050-1,000 = 500(i) Therefore (i) = 50/500 = 0.10
i.e. (i) = 10%
Compound Interest
Illustration 4: Determine the compound interest for an investment of Rs 7,500 at 6 % compounded half- yearly. Given that (1+i) n for i = 0.03 and n = 12 is 1.42576.
i = 6 / 2×100 = 0 03,
n = 6 × 2 = 12, P = 1,000
Compound Amount = 7,500(1+0.03)12 = 7,500 × 1.42576 = 10,693.20 Compound Interest = 10,693.20 – 7,500 = 3,193.20
Illustration 5: 2,000 is invested at annual rate of interest of 10%. What is the amount after 2 years if the compounding is done?
(a)Annually?
(b) Semi annually?
(c) Monthly?
(d) Daily?
Ans wer:
(a) The annual compounding is given by:
FV2 = P (1 + i) n, n being 2, i being 10/100 = 0.1 and P being 2000
(b) For semiannual compounding n = 2 × 2 = 4, i = 0.1/2 = 0.05
FV4 = 2,000 (1 + 0.05)4 = 2,000 × 1.2155 = 2,431
(c) For monthly compounding, n = 12 × 2 = 24, i = 0.1/12 = 0.00833 FV24 = 2,000 (1.00833)24 = 2,000 × 1.22029 = 2440.58
(d) For daily compounding, n = 365 × 2 = 730, i = 0.1/ (365) = 0.00027 FV730 = 2,000 (1.00027)730 = 2,000 × 1.22135 = 2,442.70
FV4 = 2,000 (1 + 0.05)4 = 2,000 × 1.2155 =2,431
Effective Rate of Interest
It is the actual equivalent annual rate of interest at which an investment grows in value when interest is credited more often than once a year. If interest is paid m times in a year it can be found by calculating:
Ei = (1+ i/m) m -1
Illustration 6: If the interest is 10% payable quarterly, find the effective rate of interest.
Solution
E = (1+ 0.1/4) 4 -1 = 0.1038 or 10.38%
Present Value
Illustration 7: What is the present value of Re. 1 to be received after 2 years compounded annually at 10%?
Solution
Here FV n = 1, i = 0.1
Required Present Value = FV n (1+i) −n
FV n = | 1 / (1.1) 2 = 1 / 1.21 |
= 0.8264 | = Re. 0.83 |
Thus, Re. 0.83 shall grow to Re. 1 after 2 years at 10% compounded annually.
Illustration 8. Future Value of A Series of Payments : -
Calculate the Future value at the end of 5 years of the following series of payment at 10% rate of interest.
R1 = Rs.1000 at the end of 1st year
R2 = Rs.2000 at the end of 2nd year.
R3 = Rs.3000 at the end of 3rd year.
R4 = Rs.2000 at the end of 4st year.
R5 = Rs. 1500 at the end of 5t h year
Vn = R1(1+i)n-1 + R2(1+i)n-2 + R3 (1+i)n-3 + R4 (1+i)n-4 + Rn
= 1000(1+.10)5-1 + 2000(1+.10)5-2 + 3000(1+.10)5-3 + 2000(1+.10)5-4 + 1500
= 1000(1.10)4 + 2000(1.10)3 + 3000(1.10)2 + 2000(1.10)1 + 1500
= 1000(1.464)+2000(1.3310)+3000(1.21) +2000(1.10) +1500
= 1464 + 2662 +3630 +2200+1500
Vn = 11456
Another Method: -
Using Compounding Factor Table
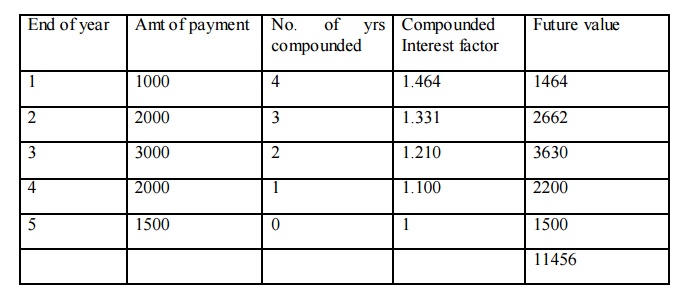
Future value of the end of 5 years = 11456
Compound Value of Annuity
Mr. A deposits Rs. 1000 at the end of every year, for a 4 years and the deposits earnscompound interest at 10% per annum. Determine how much money he will have at the end of 4 years.
R ( 1+i) n-1 + (1+i) n-2 + ……… + 1)
1000 ( 1+.10) 4-1 + (1+.10) 4-2 +(1+.10)4-3 + 1) 1000 ( 1+.10) 3 + (1+.10) 2 +(1+.10)1 + 1) 1000 ( 1.3310+1.2100+1.1000+ 1) 1000(4.6410)
=4641
(OR)
a) Using compounding Factor table Vn = ® (ACFin)
= 1000 x 4.641
= 4641
Compound Value of Annuity Due :
1. Mr. X deposits Rs. 5000 at beginning of each year of 5 years in a bank and the deposit earns a compound interest at 8% per annum. Determine how many money be will have at the end of 5 years.
=(R )(( 1+i) n + (1+i) n-1 + ……… + (1+i)1)
= 5000[(1+.08)5 + (1+.08)5-1+ (1+.08)5-2+(1+.08)5-3 +(1+.08)1]
= 5000[(1+.08)5 + (1+.08)4+ (1+.08)3+ (1+.08)2 +(1+.08)1]
= 5000[(1.0800)5+ (1.0800)4+ (1.0800)3+(1.0800)2+(1.0800)1]
= 5000(1.4693+1.3605+1.2597+1.664+1.0800)
= 5000(6.3359) = 31679.5
b) Using compounding factor table
Vn= ® (ACFin) (1+P)
= 5000x5.867 (1+.08) = 5000 x 5.867 (1.08) = 31681
B. Discount (or) present value technique: -
You have an opportunity to buy a debenture today and you will get back Rs, 1000 after one year. What will you be willing to pay for the debenture today if your time performance for money is 10% per annum?
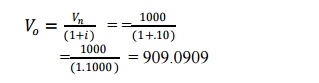
Present value Vo = Future value (Vn) x DFin
= 1000 x 0.90909
= 909.0900
Present Value Series of Payment
Calculate present value of the following cash flows assuming a discount rate of 10%
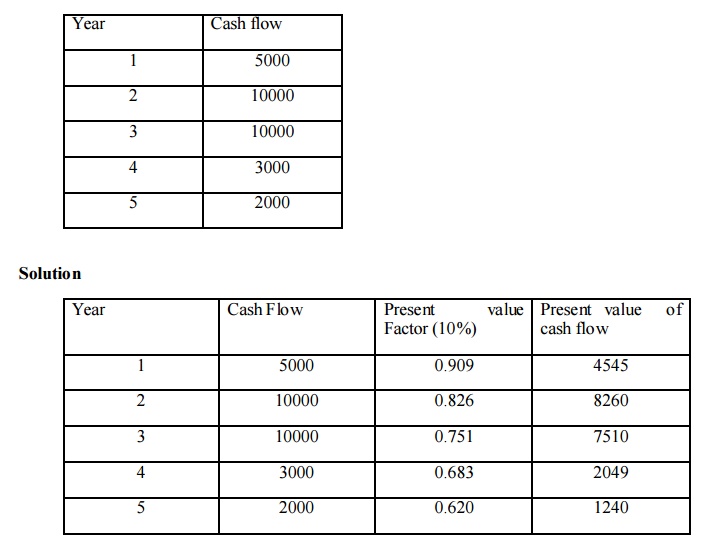
Total present value of cash flow = 23604
Present Value of an Annuity
1. Mr. X has to receive Rs. 2000 per year for 5 years. Calculate present value of equity assuming that he can earn interest on his investment at10% P.A.
Vo = (R) (ADFin)
= 2000 x 3.791
= 7582
Present Value of an Annuity Due:-
1. Mr. A has to receive Rs. 1000 at the beginning of each year for 5 years. Calculate the present value of an annuity due assuming 10% rate of interest.
Vo = (1000) (3.791) (1+-10)
= 1000 x 3.791 (1.10)
= 4170
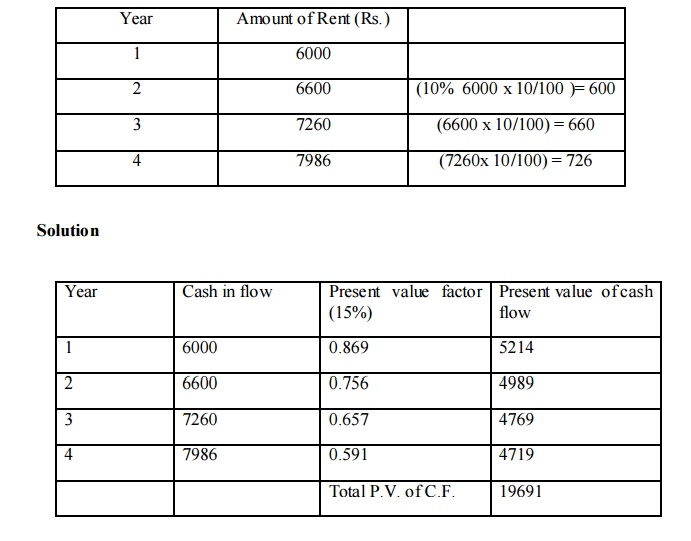
Present Value of an Annuity Growing at Constant Rates
1. Mr. X has rented out a portion of his house for 4 years at an annual rent Rs. 6000 units with the stipulation that rent will increase by 10% every year. If the required rate of return is 15%. What is the present value of the expected series of Rent?
a) Calculate the series of payment of rent
Valuation Of Bonds
ILLUSTRATION
Let us assume the face value of the bond is $1,000 (maturity value $1,000). The bond has a 10% coupon rate payable semi-annually and the yield to maturity (return) is 9%. The bond matures in 5 years period from now. What is the value of the bond?
Interest 1 till 10 = $50 per semi-annual period. ($100 annually) n=10 because 5 years x 2 payments per period.
Yield to maturity = 9%, therefore, semi-annual YTM (return) =9/2 = 4.5% or 0.045 Solving for the above equation, we get
Bond price = $1,040 (rounded)
Payback period
Illuatration
If the cash flows are equivalent, how the payback period is to be calculated?
The cost of the project is Rs.1,00,000. The annual earnings of the project is Rs.20,000. Calculate the payback period.
Payback period = Average Annual Earnings / Initial Investment = 1,00,000 / 20,000 = 5 years
It is obviously understood that, Rs.20,000 of annual earnings (cash inflows) requires 5 years time period to get back the original volume of the investment.
Illuatration
If the cash flows are not equivalent, how the payback period is to be calculated?
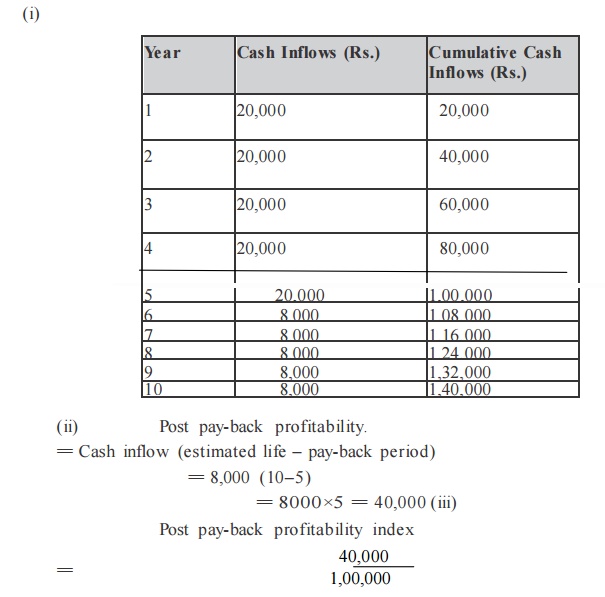
The cost of the project is Rs.1,00,000. The annual earnings of the project are as
follows
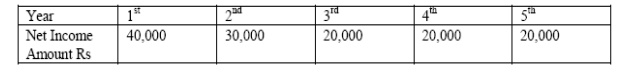
· The ultimate aim of determining the cumulative cash inflows to find out how many number o f years taken by the firm to recover the initial investment.
The next step under this method is to determine the cumulative cash flows
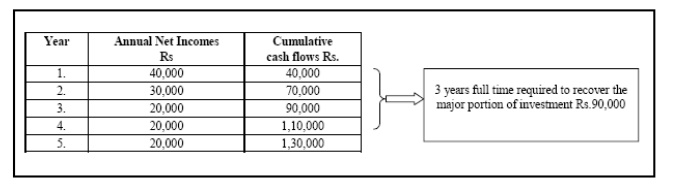
The uncollected portion of the investment is Rs,10,000. This Rs.10,000 is collected from the 4th year Net income / cash inflows of the enterprise. During the 4th year the total earnings amounted Rs.20,000 but the amount required to recover is only Rs.10,000. For earning Rs.20,000 one full year is required but the amount required to collect it back is amounted Rs.10,000. How many months the firm may require to collect Rs.10,000 out of the entire earnings Rs.20,000.
v Payback period consists of two different components
v Payback period for the major portion of the investment collection in full course - E.g.: 3 years
v Payback period for the left /uncollected portion of the investment
v For the second category 0.5 years
v = 10000/20000 = 0.5 years
Total payback period= 3 Years +.5 year = 3.5 years
Illustration
A project costs Rs.2,00,000 and yields and an annual cash inflow of Rs.40,000 for 7 years. Calculate payback period
First step is identify the nature of the annual cash inflows
In this problem, the annual cash inflows are equivalent throughout life period of the
project
Pay Back Period = 2,00,000/ 40,000 = 5years
Illustration
Calculate the payback period for a project which requires a cash outlay of Rs.20,000 and generates cash inflows of Rs 4,000 Rs.8,000 Rs. 6,000 and Rs. 4,000 in the first, second, third, and fourth year respectively
First step is to identify the nature of the cash inflows The cash inflows are not equivalent/constant
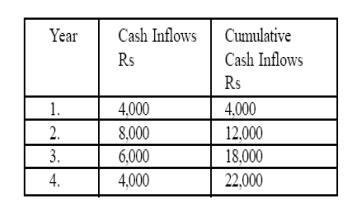
v Cost of the project is to be recovered Rs.20,000. The project takes 3 full year‘s time period to recover the major portion of the initial investment which amounted Rs.18,000 out of Rs.20,000
v The remaining amount of the initial investment is recovered only during the fourth year.
v The left portion Rs.2,000 has to be recovered only from the fourth year cash inflows of Rs.4,000.
v Pay Back Period = Pay Back period of the major portion + Pa y Back period of the remaining portion
v Pay Back period of the major portion = 3 years
Illustration A project cost Rs. 500000 and yield annually a profit Rs. 80000, after depreciation at 12% per annum but before tax 50%. Calculate payback period.
Profit before tax = 80000
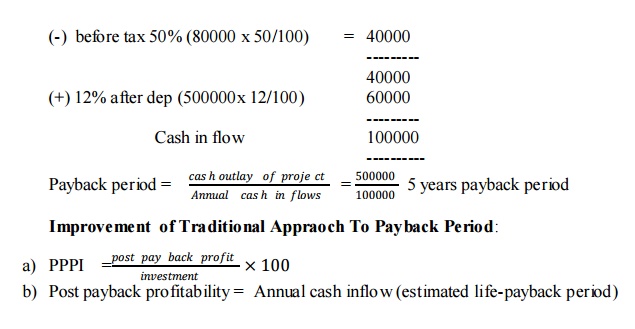
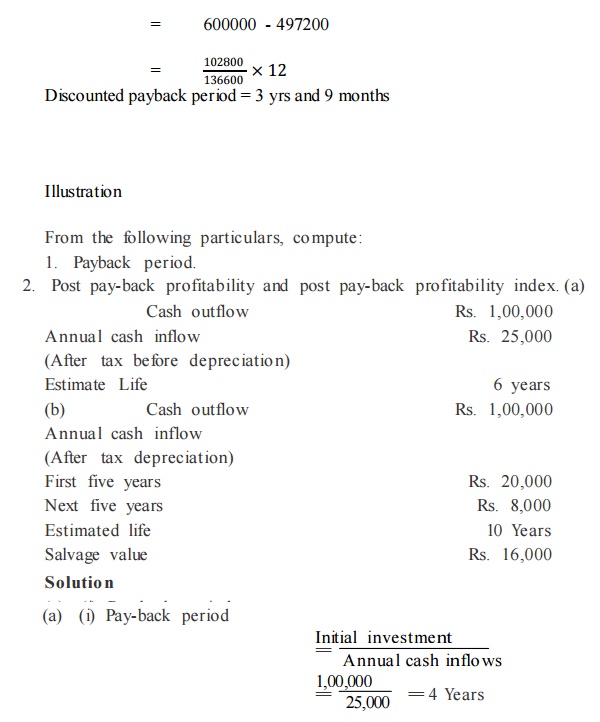
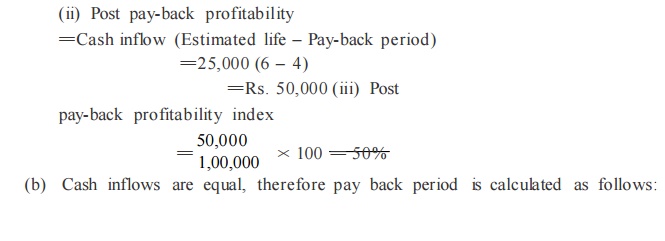
Illustration
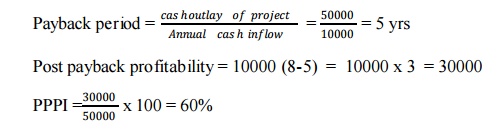
Calculate post payback profitability index. Initial outlay Rs. 50000, Annual cash flow(after tax before depreciation) Rs. 10000, Estimated life 8 years.
Discounted payback period
Illustration
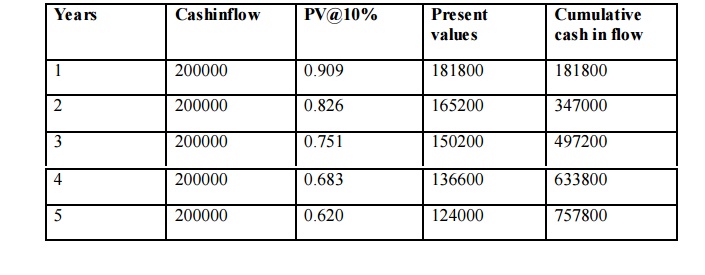
Calculate discounted payback period from the information given below.
Cost of project = Rs. 600000
Life of project = 5 years
Annual cash inflows Rs. 200000 for each year
Cutoff rate 10%
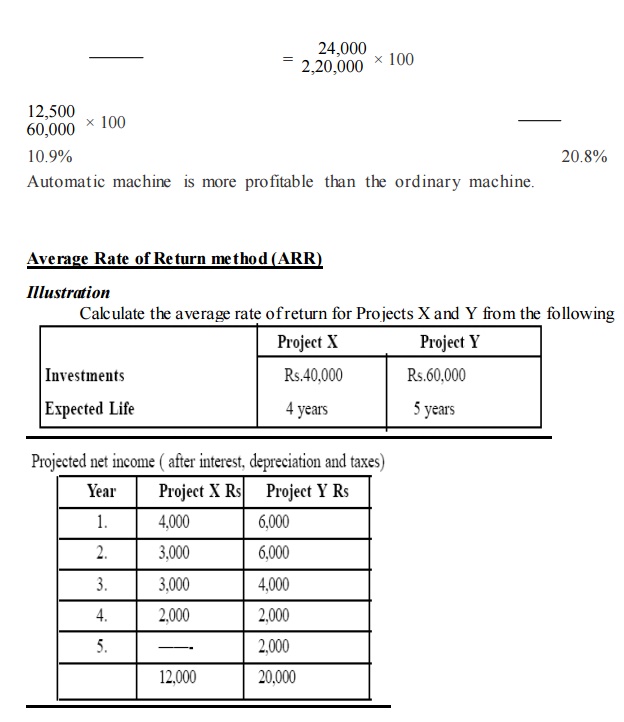
v If the required rate of return is 10% which project should be undertaken?
v Average Rate of Return = Original Investment / Average Annual Income X100
v The first step is to find out the average annual income of the two different projects X and Y
v Average Annual Income Total income throughout the Project / Life of the Project
v Average Annual Income (Project X) = Rs. 12,000 / 4 years = Rs. 3,000
v Average Annual Income (Project Y) = Rs. 20,000 / 5 years = Rs. 4,000
v The next step is to find out the Average rate of return:
v Average rate of return (Project X) = Rs. 3,000 / Rs.40,000 X100 =7.5%
v Average rate of return (Project Y) = Rs.5,000/ Rs. 60,000 X 100 = 8.33%
v Both the projects are lesser than the given required rate of return. These two projects are not advisable to invest only due to lesser accounting rate of return.
Net present value method(NPV)
Illustration
Calculate the NPV of 2 projects and suggest which of 2 projects should be accepted assuming a discount rate 10%
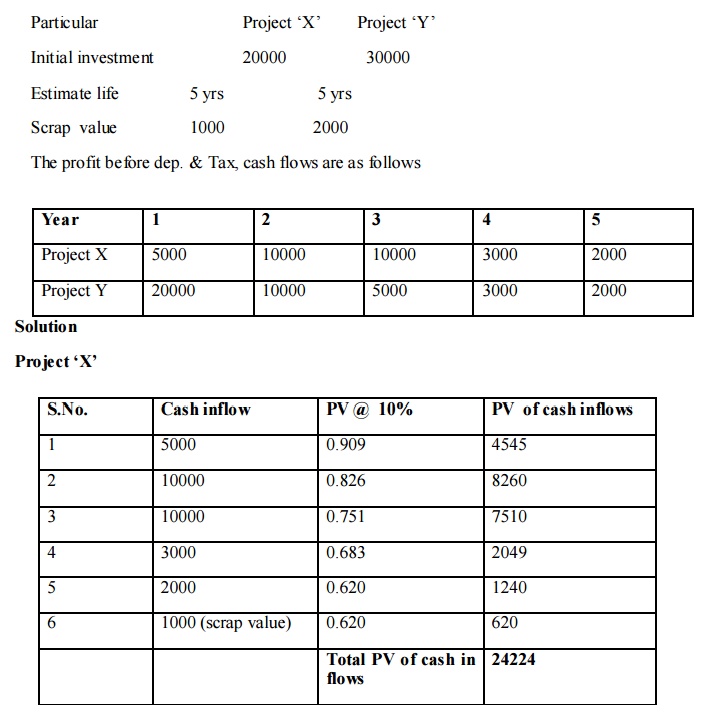
NPV = PV cash of inflow - PV of cash outflows = 24224 - 20000 NPV = 4224
Project Y
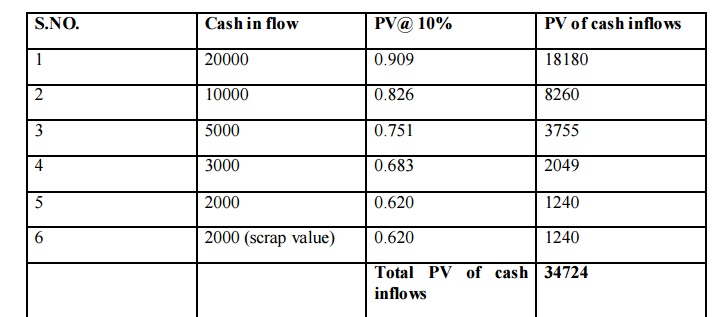
NPV = PV of cash inflow - PV of cash outflows
NPV = 34724 – 30000
NPV = 4724
Comment:
NPV of project y is higher than the NPV of project x. Hence, it is suggested that project y should be selected.
Illustration
A company is considering investment in a project that cost Rs. 2 lakh the project that cost Rs. 2 lakh the project has an expected life of 5 years and zero solvage (scrap) value. The company uses straight line method of depreciation (40,000),Tax Rate is 40%
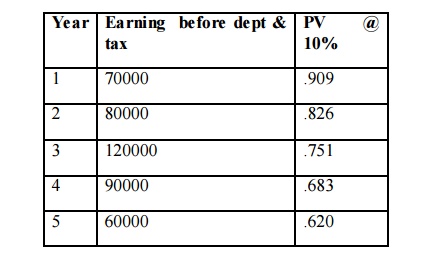
You are require to calculate the Net present value @ 10 % and advice the company
Solution
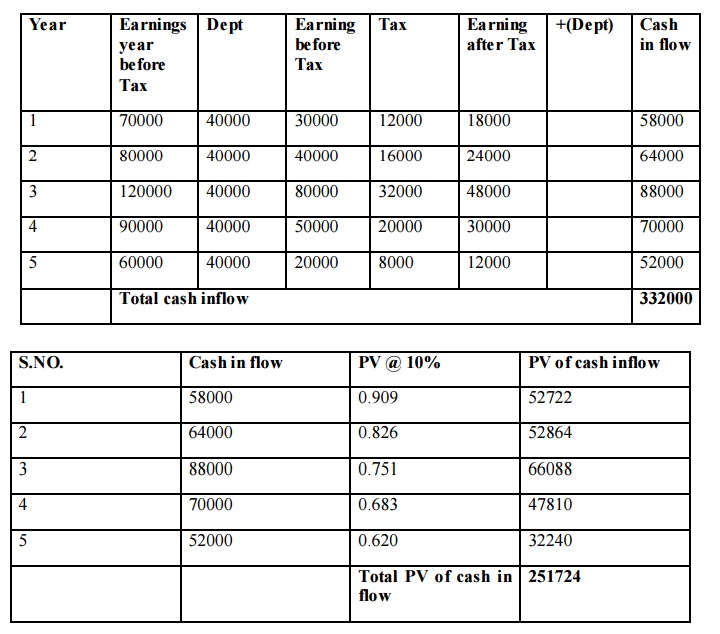
NPV = PV of cash inflow – PV of cash outflow
= 251724 – 200000
= 51724
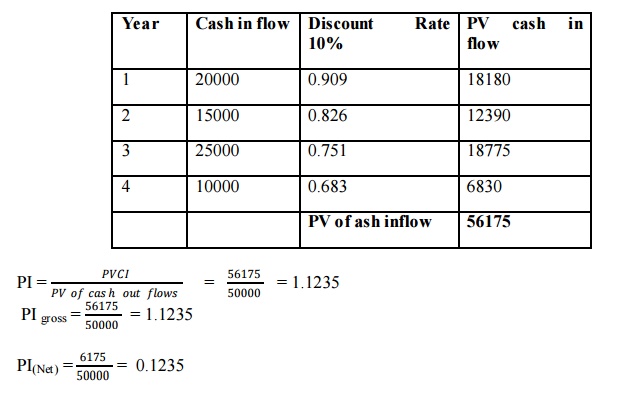
Profitability Index Method (or) Benefit cost Ratio: -
Initial cash outlay of a project Rs. 50000, cash flows 20000, 15000, 25000, 10000 for 4 years Rate of Discount 10% calculate PI
Illustration
Inte rnal Rate of Return Method (IRR)
Illustration
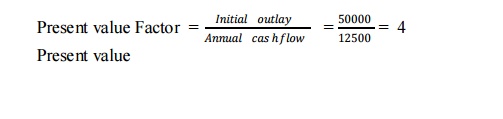
1) Initial outlay Rs. 50000, life of an asset 5 years Annual cash flow RS. 12500, calculate IRR
Illustration
Initial outlay Rs. 50000, life of an asset 5 years Annual cash flow Rs. 12500, Calculate IRR
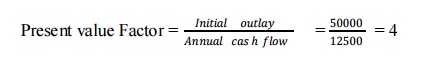
Present value of annuity table 8 % approximately
IRR = 8 %
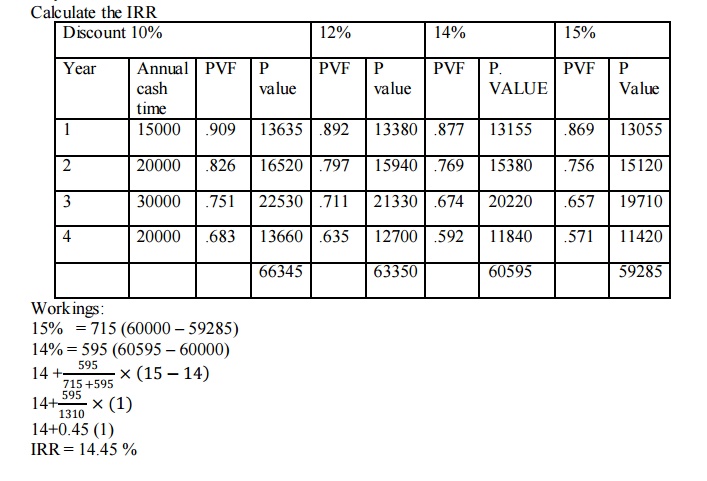
Illustration
When the annual cash flows over the life of the asset.
Initial investment Rs. 60000, Life of the Assets 4 years
1st year - 15000
2nd year – 20000
3rd year – 30000
4th year -20000 Calculate the IRR
Dividend Price Approach
Illustration
A company has on its books the following a mounts and specific costs of each type of capital.
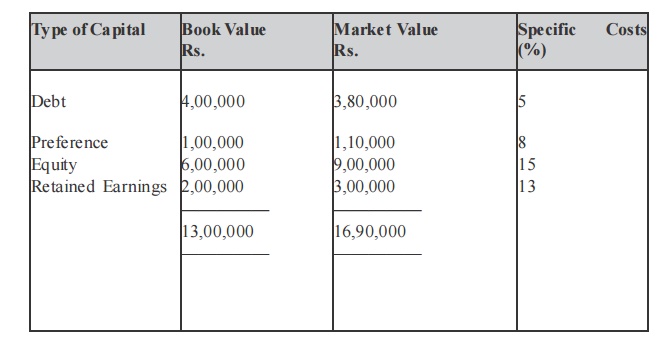
Solution
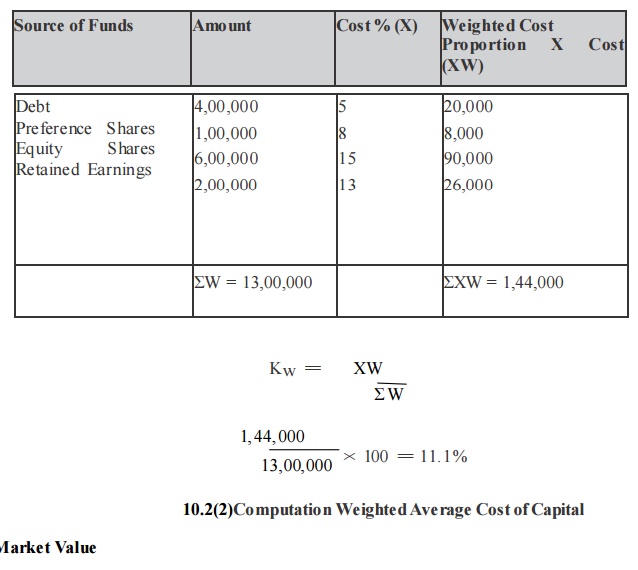
A. Book value
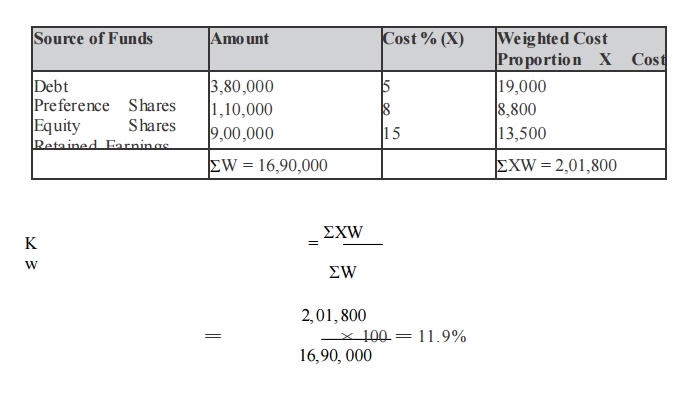
Computation of Weighted Average Cost of Capital
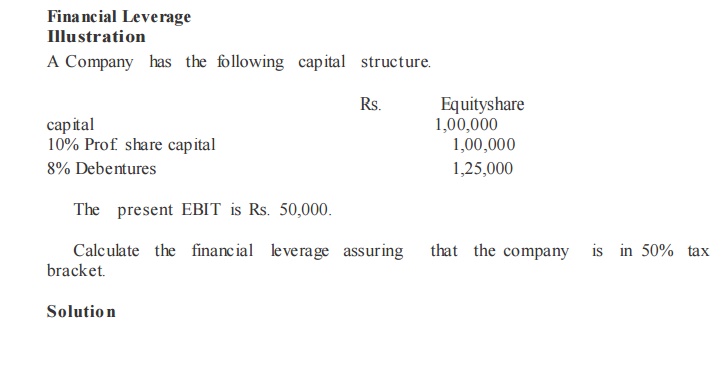
Ope rating Leverage
Illustration
From the following selected operating data, determine the degree of operating leverage. Which company has the greater a mo unt of business risk? Why?
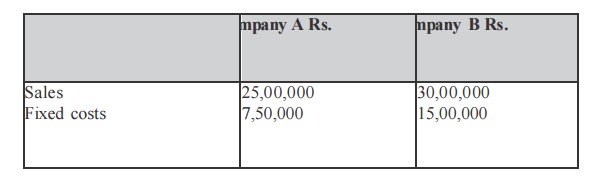
Variable expenses as a percentage of sales are 50% for company A and 25% for company B.
Solution
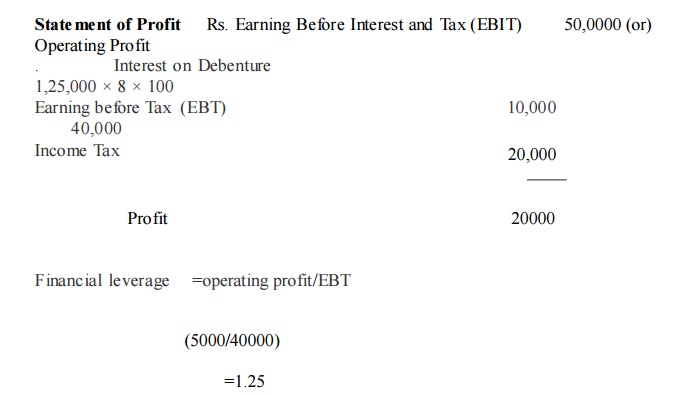
Statement of Profit
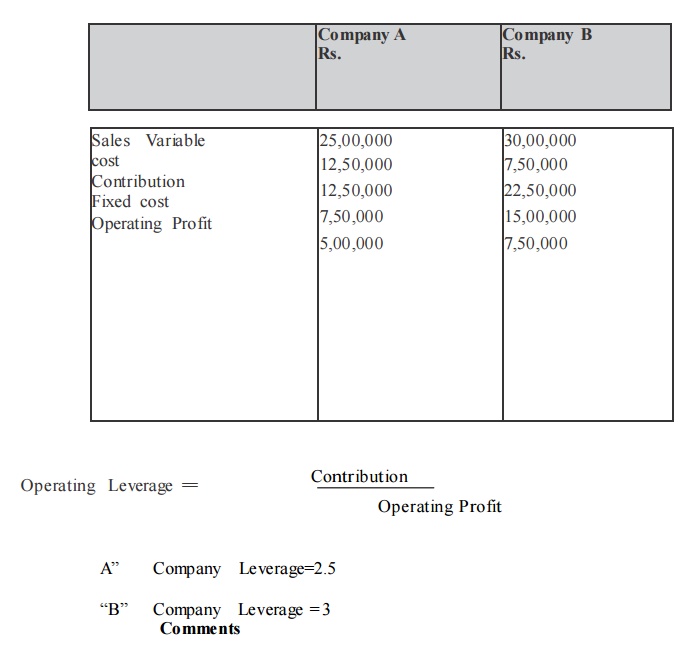
Operating leverage for B Company is Aigher than that of A Company; B Company has a higher degree of operating risk. The tendency of operating profit may vary portionately with sales, is higher for B Company as compared to A Company.
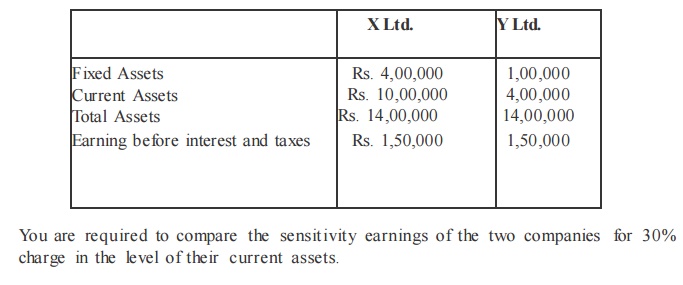
Illustration
The following information is available for two companies.
ILLUSTRATION
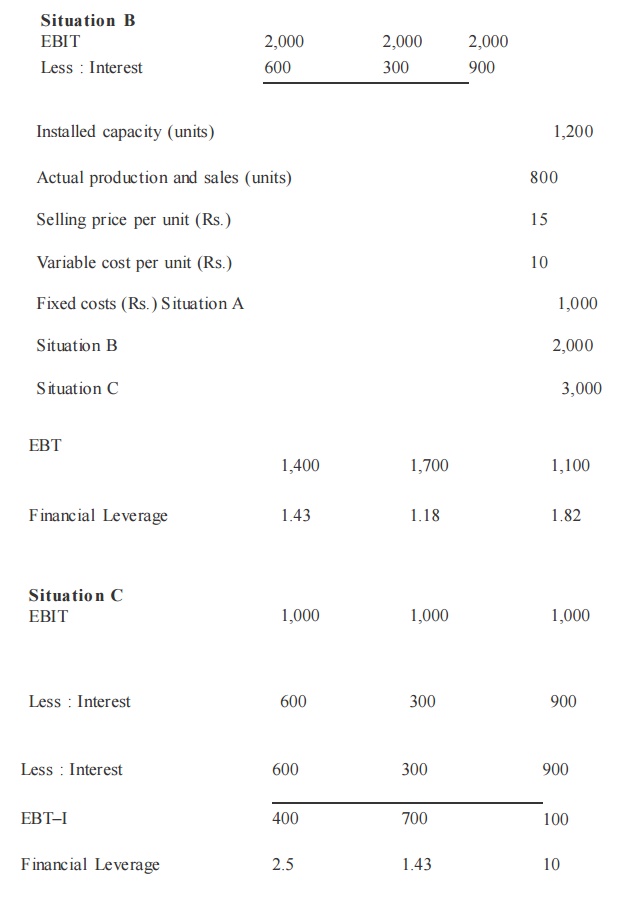
Calculate operating leverage and financial leverage under situatio ns A, B and C and financial plans 1, 2 and 3 respectively from the following infor mation relating to the operating and financial leverage which give the highest value and the least value.
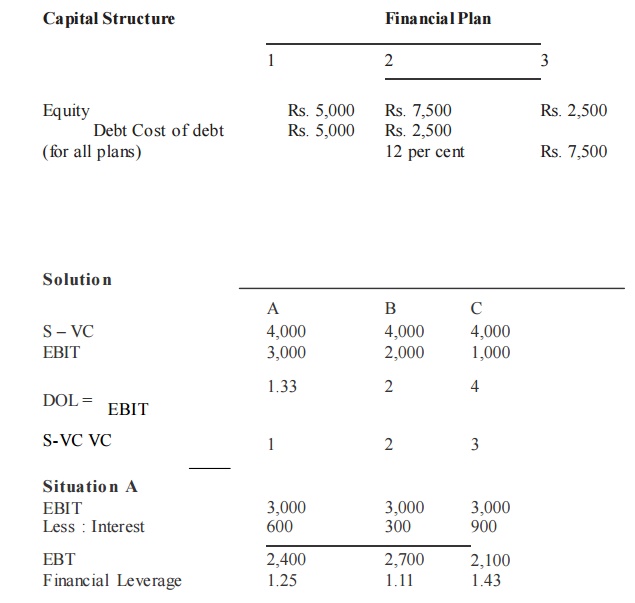
FINANCIAL STRUCTURE
Example
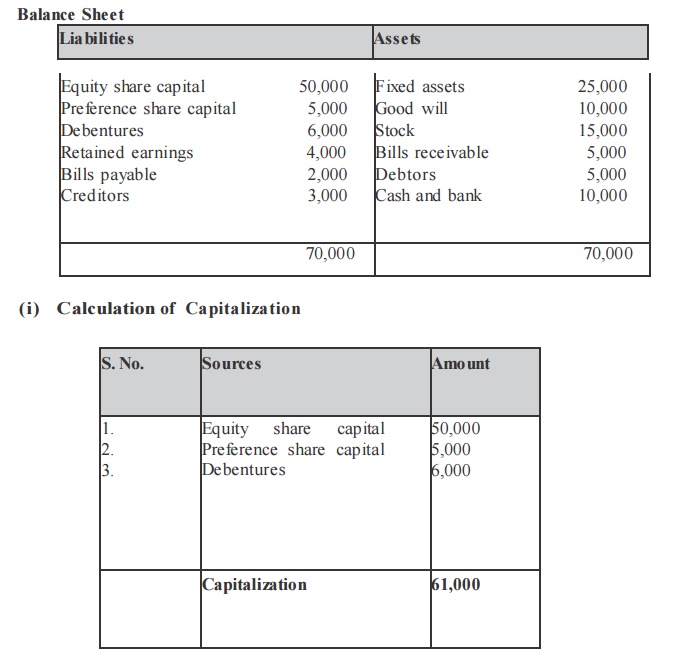
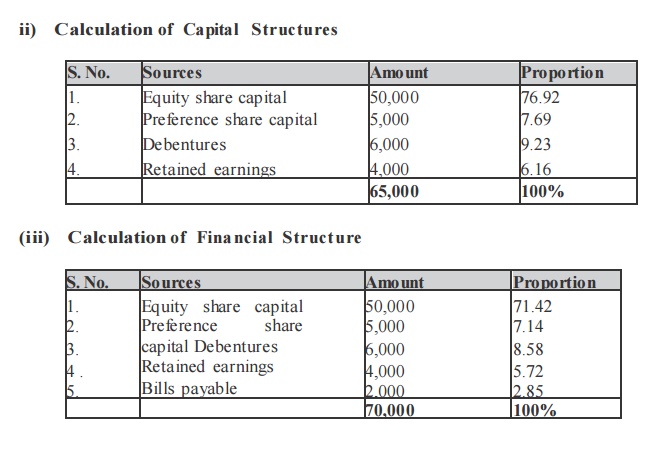
From the following information, calculate the capitalization, capital structure and financial structures.
Balance Sheet
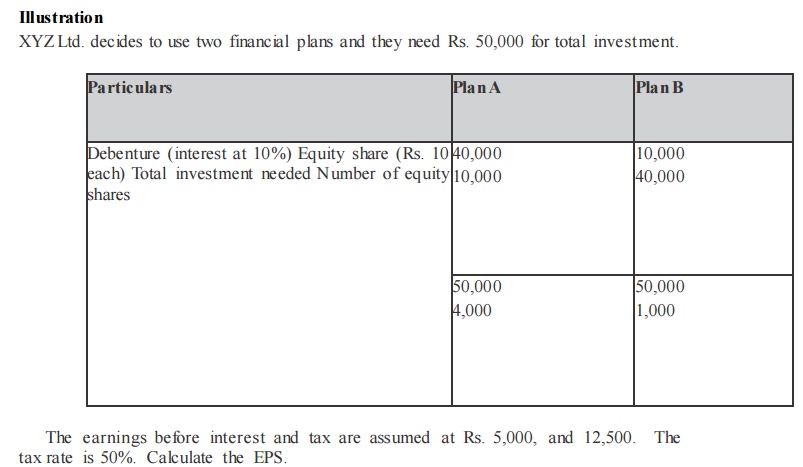
illustration
ABC Ltd., needs Rs. 30,00,000 for the installation of a new factory. The new factory expects to yield annual earnings before interest and tax (EBIT) of Rs.5,00,000. In choosing a financial plan, ABC Ltd., has an objective of maximizing earnings per share (EPS). The company proposes to issuing ordinary shares and raising debit of Rs. 3,00,000 and Rs. 10,00,000 of Rs. 15,00,000. The current market price per share is Rs. 250 and is expected to drop to Rs. 200 if the funds are borrowed in excess of Rs. 12,00,000.
Funds can be raised at the following rates.
–up to Rs. 3,00,000 at 8%
–over Rs. 3,00,000 to Rs. 15,000,00 at 10%
–over Rs. 15,00,000 at 15%
Assuming a tax rate of 50% advise the company.
Solutio n
Earnings Before Interest and Tax (BIT) less Interest Earnings Before Tax less: Tax@50%.
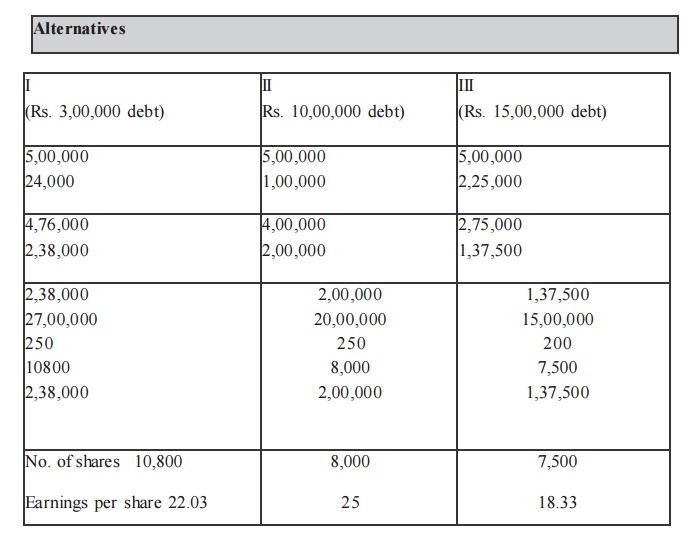
The secure alter native which gives the highest earnings per share is the best. Therefore the company is advised to revise Rs. 10,00,000 through debt a mo unt Rs. 20,00,000 through ordinary shares.
illustration
Compute the market value of the firm, value of shares and the average cost of capital from the following information.
Net operating income Rs. 1,00,000
Total investment Rs. 5,00,000
Equity capitalization Rate:
(a) If the firm uses no debt 10%
(b) If the firm uses Rs. 25,000 debentures 11% (c)
If the firm uses Rs. 4,00,000 debentures 13%
Assume that Rs. 5,00,000 debentures can be raised at 6% rate of interest whereas
Rs. 4,00,000 debentures can be raised at 7% rate of interest.
Solutio n
Computation of market value of firm value of shares and the average cost of capital.
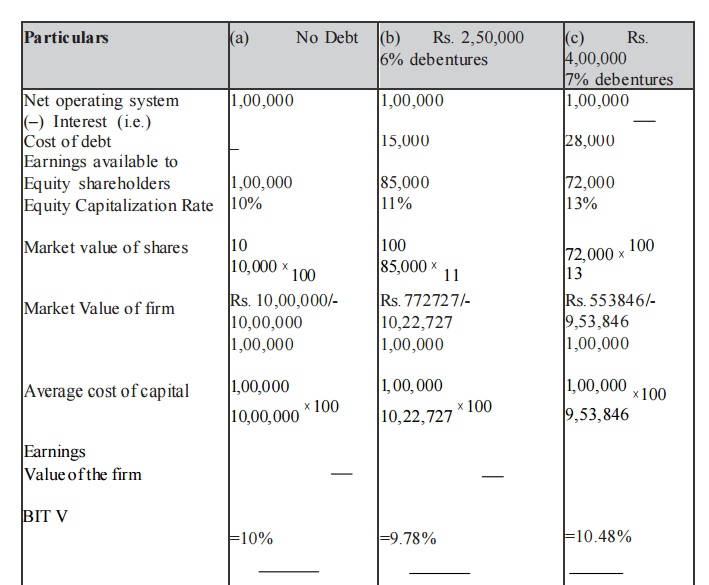
Comments
From the above data, if debt of Rs. 2,50,000 is used, the value of the firm increases and the overall cost of capital decreases. But, if more debt is used to finance in place of equity i.e., Rs. 4,00,000 debentures, the value of the firm decreases and the overall cost of capital increases.
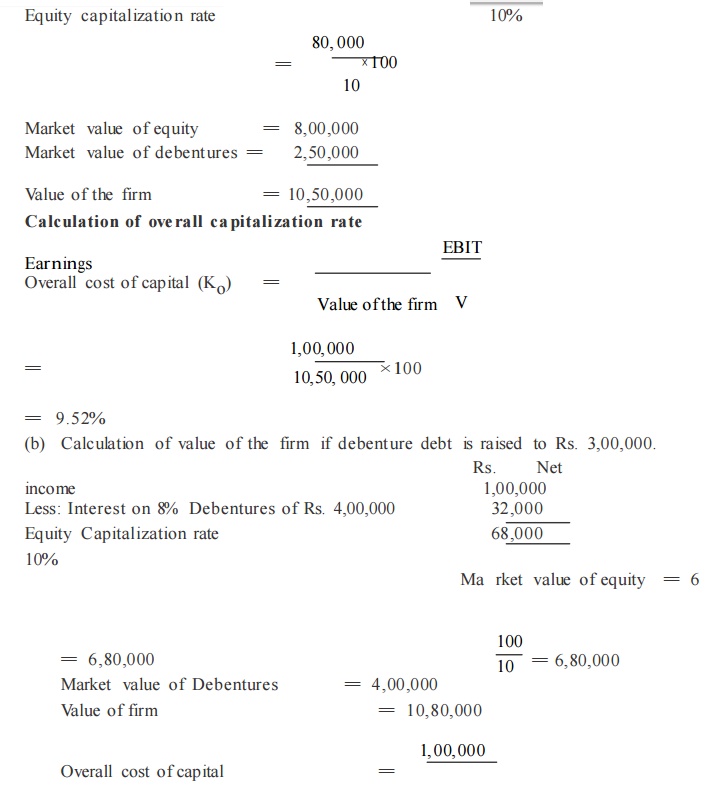
illustration
(a) A Company expects a net income of Rs. 1,00,000. It has Rs. 2,50,000, 8% debentures.
The equality capitalization rate of the company is 10%. Calculate the value of the firm and overall capitalization rate according to the net income approach (ignoring income tax).
(b) If the debenture debts are increased to Rs. 4,00,000. What shall be the value of the firm and the overall capitalizatio n rate?
Solution
(a) Capitalization of the value of the fir m Rs.
Net income 1,00,000
Less: Interest on 8% Debentures of Rs. 2,50,000 20,000
Earnings available to equality shareholders 80,000
Equity capitalizatio n rate 10%
XYZ expects a net operating income of Rs. 2,00,000. It has 8,00,000, 6% debentures. The overall capitalization rate is 10%. Calculate the value of the firm and the equity capitalization rate (Cost of Equity) according to the net operating income approach.
If the debentures debt is increased to Rs. 10,00,000. What will be the effect on volume of the firm and the equity capitalization rate?
Solutio n
Net operating income = Rs. 2,00,000
Overall cost of capital = 10%
Market value of the firm (V)
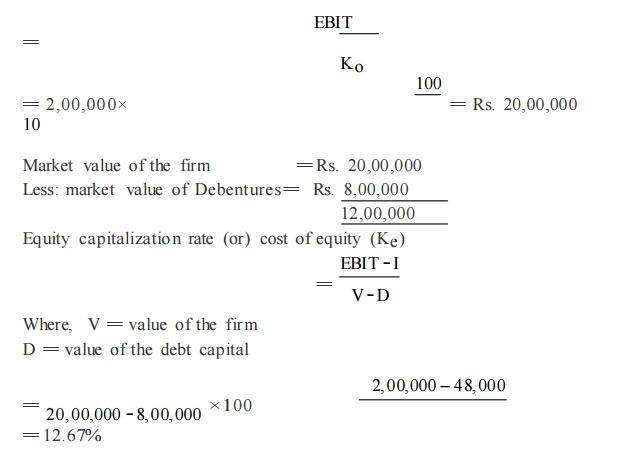
If the debentures debt is increased to Rs. 10,00,000, the value of the firm shall rema in changed to Rs. 20,00,000. The equity capitalization rate will increase as follows:
illustration
Financing Decision and working capital management
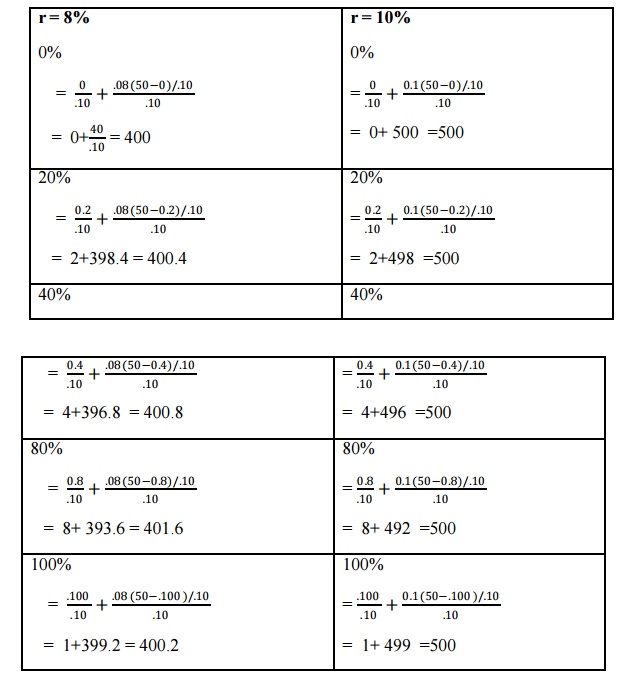
- 1Capitalization rate is 10%, Earning per share Rs. 50. Assume rate of return on investment 12%, 8%,
- 10 % show the effect of dividend policy on market price per share applying watter‘s formula when
- dividend payout ratio is
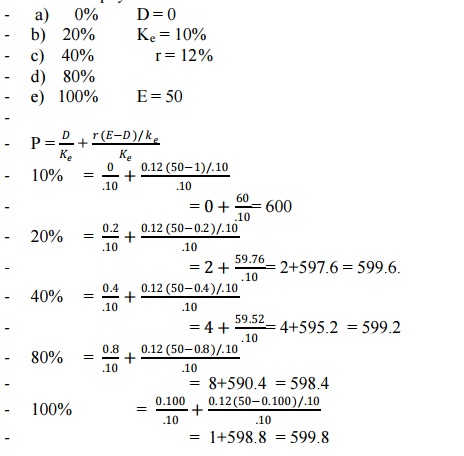
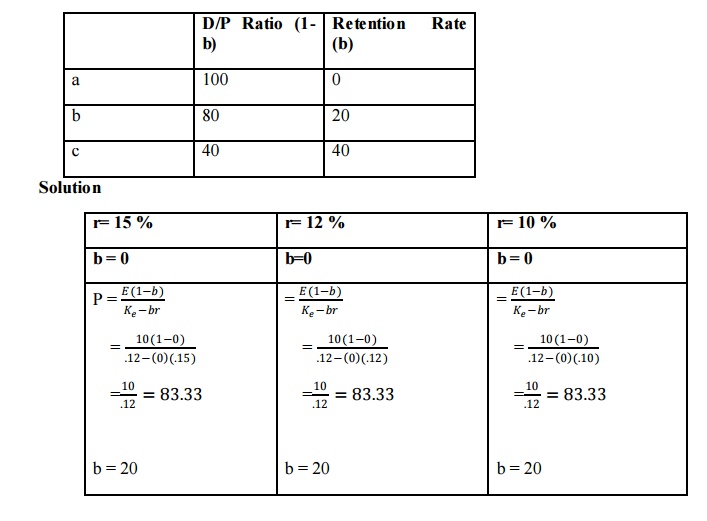
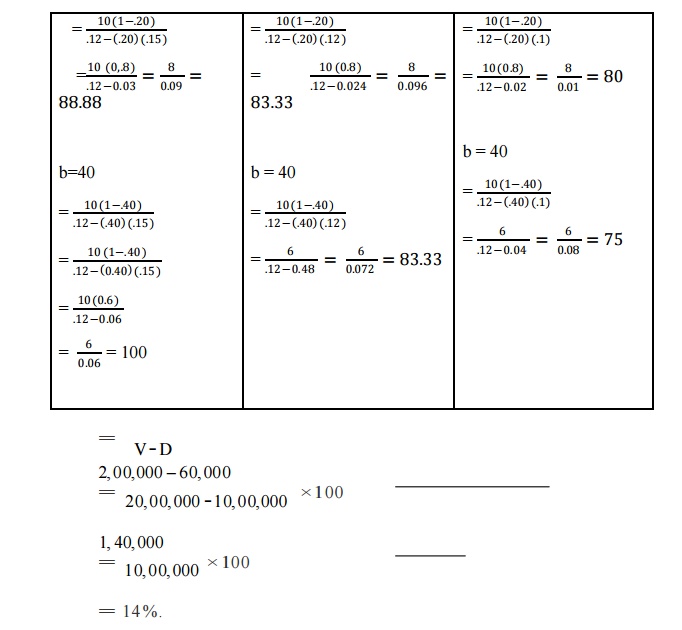
2. The following information in available irrespective of r, k, e of ABC Ltd. Rate of reture R = 15%, r = 12% r = 10% cost of capital = 12%, Earning per share 10 determine the value of its shares using Gordons model assuming the following
= 9.26 %
Thus, it is evident that with the increase in debt financing, the value of the firm has increased and the overall cost of capital has increased.
Problem
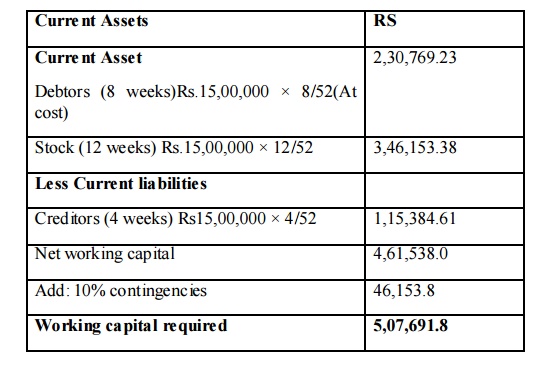
1. Prepare an estimate of working capital requirement from the following data of the XYZ Ltd.
a) Projected annual sales volume 2,00,000 units
b) Selling price Rs.10 per unit
c) % of net profit on sales 25%
d) Average credit period allowed to customers 8 weeks
e) Average credit period allowed by suppliers 4 weeks
f) Average holding period of the inventories 12 weeks
g) Allow 10% for contingencies
Solution
Statement of working capital requirements
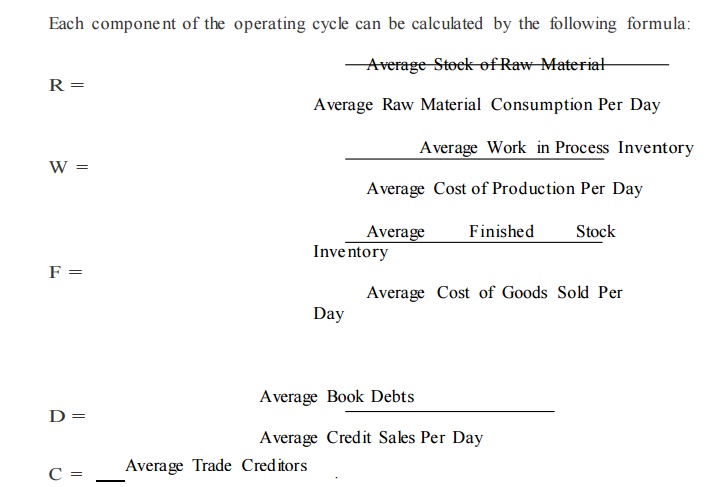
Average Credit Purchase Per Day
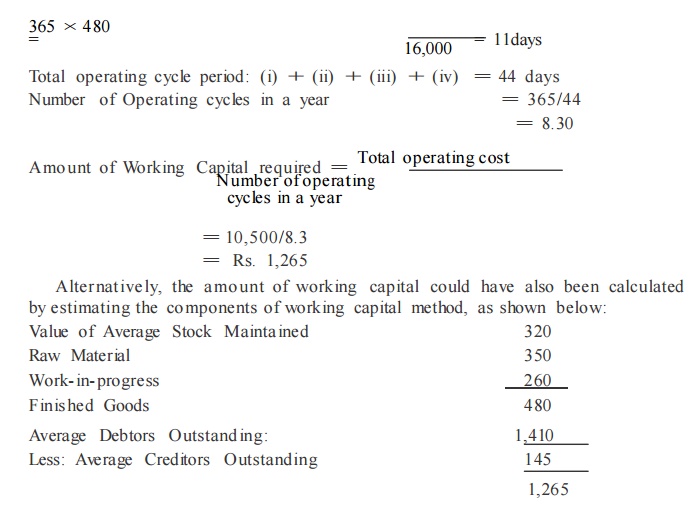
From the following information extracted from the books of a ma nufacturing company, compute the operating cycle in days and the a mount of working capital required:
Period Covered 365 days
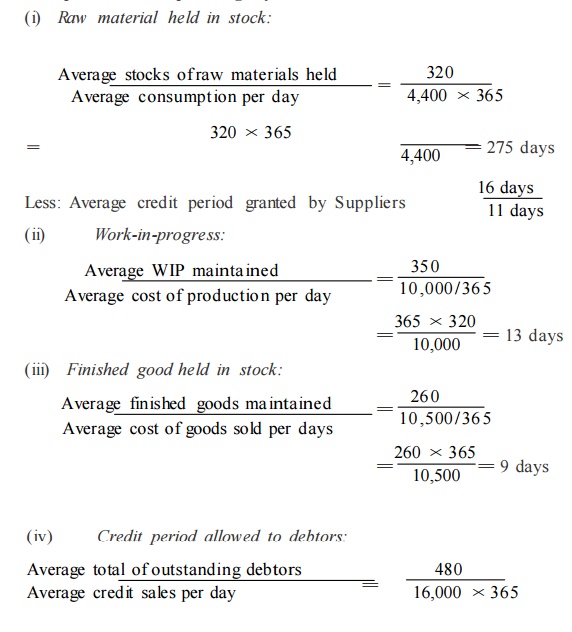
Average period of credit allowed by suppliers 16 days
Average Total of Debtors Outstand ing 480 00
Raw Material Consumption 4,400 00
Total Production Cost 10,000 00
Total Cost of Sales 10,500 00
Sales for the year 16,000 00
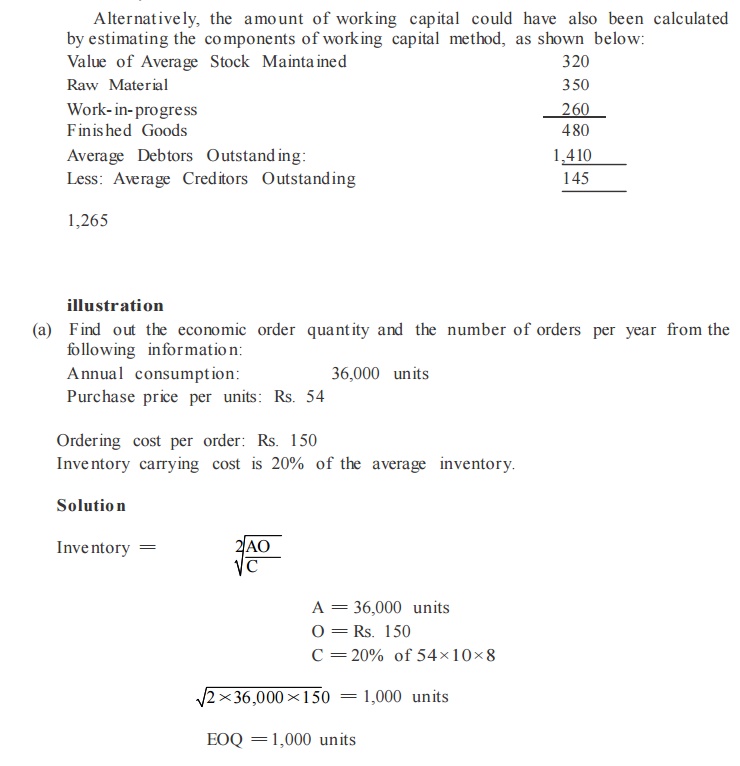
Value of Average Stock maintained :
Raw Material 320 00
Work- in- progress 350 00
Finished Goods 260 00
illustration
From the following information extracted from the books of a manufacturing company, compute the operating cycle in days and the a mount of working capital required:
Period Covered 365 days
Average period of credit allowed by suppliers 16 days
Average Total of Debtors Outstanding 480 00
Raw Material Consumption 4,400 00
Total Production Cost 10,000 00
Total Cost of Sales 10,500 00
Sales for the year 16,000 00
Value of Average Stock maintained :
Raw Material 320 00
Work- in- progress 350 00
Finis hed Goods 260 00
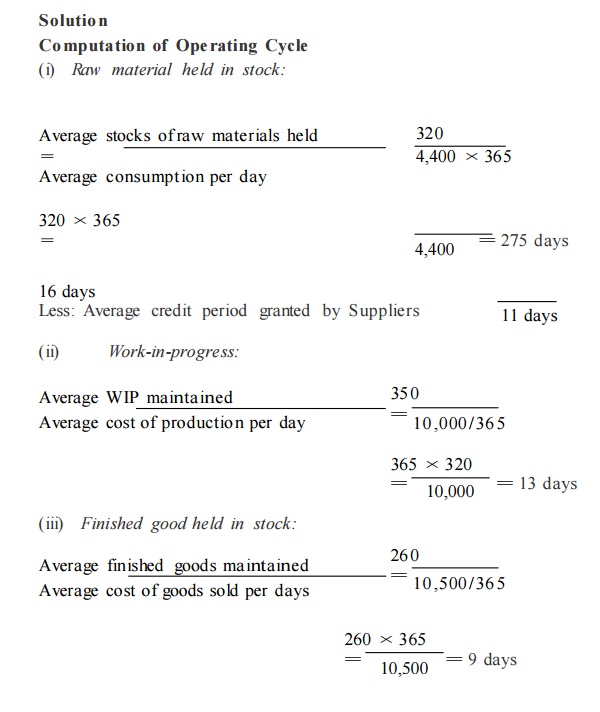
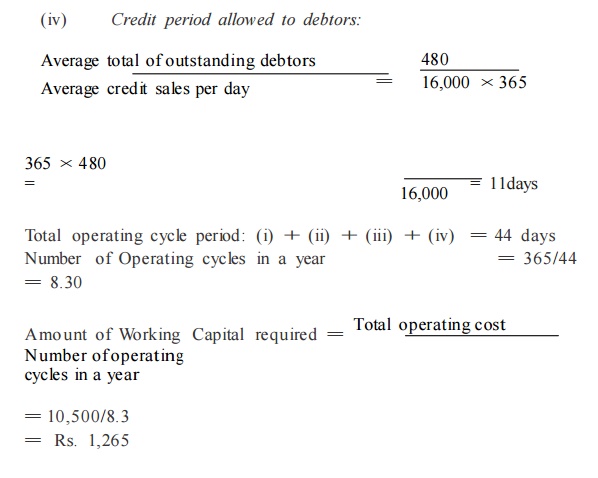
Solution
Computation of Ope rating Cycle
(i) Raw material held in stock:
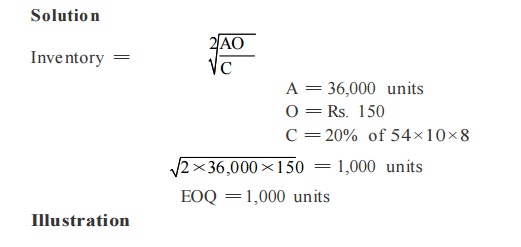
Exercise 1
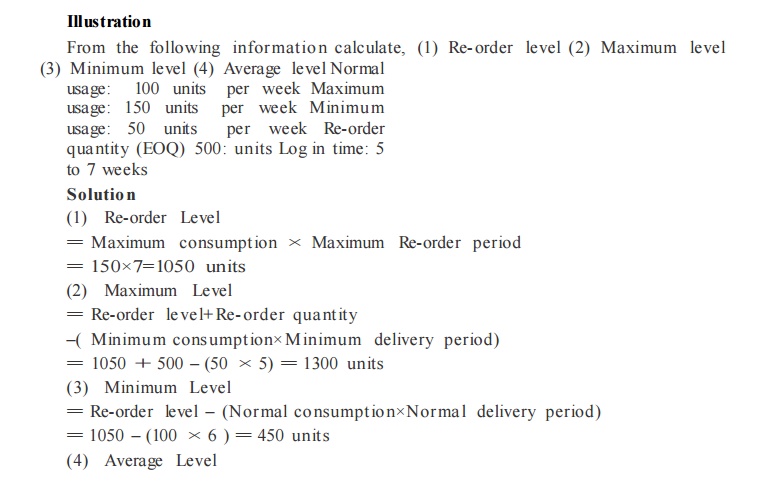
(a) Find out the economic order quantity and the number of orders per year from the following information:
Annual consumption: 36,000 units
Purchase price per units: Rs. 54
Ordering cost per order: Rs. 150
Inventory carrying cost is 20% of the average inventor y.
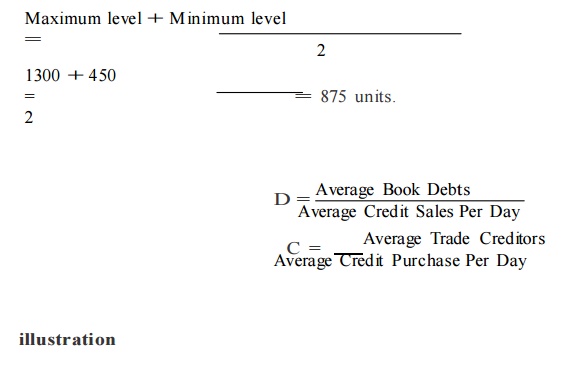
From the following information calculate, (1) Re- order level (2) Maximum level
(3) Minimum level (4) Average level Normal usage: 100 units per week Maximum usage: 150 units per week Minimum usage: 50 units per week Re-order quantity (EOQ) 500: units Log in time: 5 to 7 weeks
Solutio n
(1) Re-order Level
= Maximum consumption × Maximum Re-order period
= 150×7=1050 units
(2) Maximum Level
= Re-order le ve l+ Re- order qua ntity
–( Minimum consumption× Minimum delivery period) = 1050 + 500 – (50 × 5) = 1300 units
(3) Minimum Level
= Re-order level – (Nor mal co nsumption×Normal delivery period) = 1050 – (100 × 6 ) = 450 units
Illustration
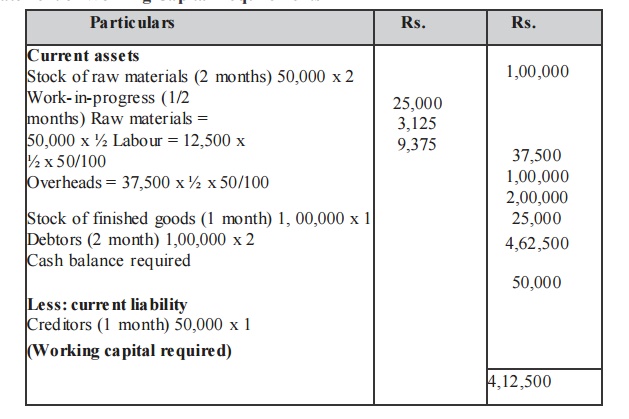
The board of directors of Aravind mills limited request you to prepare a statement showing the working capital requirements for a level of activity of 30,000 units of output for the year. The cost structure for the company‘s product for the above mentioned activity level is given below.
(a)Past experience indicates that raw materials are held in stock, on an average for 2 months.
(b) Work in progress (100% complete in regard to materials and 50% for labour and overheads) will be half a month‘s production.
(c) Finished goods are in stock on an average for 1 month.
(d) Credit allowed to suppliers: 1 month.
(e) Credit allowed to debtors: 2 months.
(f) A minimum cash balance of Rs 25,000 is expected to be maintained. Prepare a state me nt of working capital requirements.
Solution
Output per annum = 30,000 units
Output per annum = 12% of 30,000 =2,500 units
Raw materials p. m. Rs. 20×2500 = 50,000
Labour p. m. Rs. 5×2,500 = 12,500
Overheads p. m. Rs. 15×2,500 = 37,500
Total: 1,00,000
Statement of Working Capital Require ments
illustration
Prepare an estimate of working capital requirement from the following information of a trading concern.
Projected annual sales 10,000 units
Selling price Rs. 10 per unit
Percentage of net profit on sales 20% Average
credit period allowed to customers 8 Weeks
Average credit period allowed by suppliers 4 Weeks
Average stock holding in terms of sales require me nts12 Weeks
Allow 10% for contingencies
Solution
Statement of Working Capital Requirements
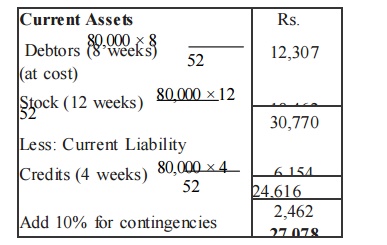
Working Notes
Sales = 10000×10 = Rs. 1,00,000
Profit 20% of Rs. 1,00,000 = Rs. 20,000
Cost of Sales=Rs.1,00,000 – 20,000 = Rs. 80,000
As it is a trading concern, cost of sales is assumed to be the purchases.
Illustration
Prepare an estimate of working capital require me nt from the following informations of a trading concern.
Projected annual sales Rs. 6,50,000
Percentage of net profit on sales 25% Average
credit period allowed to debtors 10 Weeks
Average credit period allowed by creditors 4 Weeks
Average stock holding in terms of sales requirements 8 Weeks
Allow 20% for contingencies
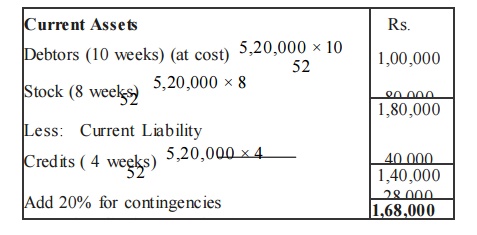
Working Notes
Sales = Rs. 6,50,000
Profit 25 /125 of Rs. 6,50,000 = Rs. 1,30,000
Cost of Sales= Rs. 6,50,000 –1,30,000=Rs. 5,20,000
As it is a trading concern, cost of sales is assumed to be the purchases.
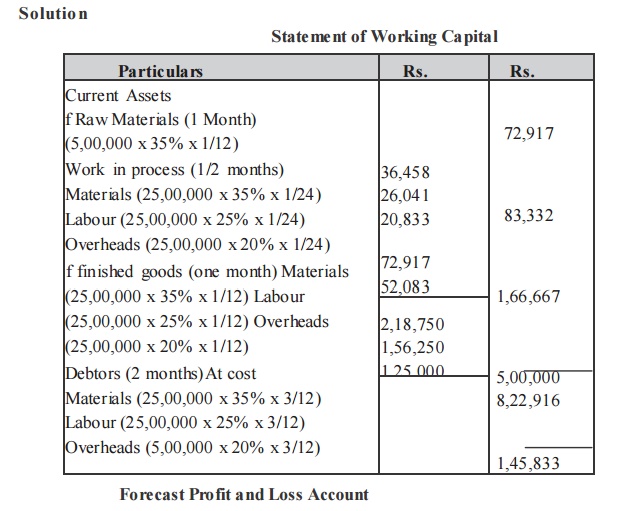
Illustration
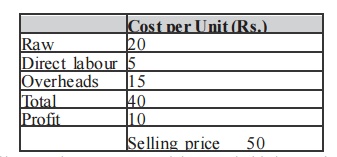
A Performa cost sheet of a company provides the following particulars :
Elements of cost
Material 35%
Direct Labours 25%
Overheads 20%
Further particulars available are:
(i) It is proposed to maintain a level of activity of 2,50,000 units.
(ii) Selling price is Rs. 10/- per unit
(iii) Raw materials are to remain in stores for an average period of one mo nth.
(iv) Finished foods are required to be in stock for an average period of one mo nth.
( v) Credit allowed to debtors is 3 months.
(vi) Credit allowed by suppliers is 2 months.
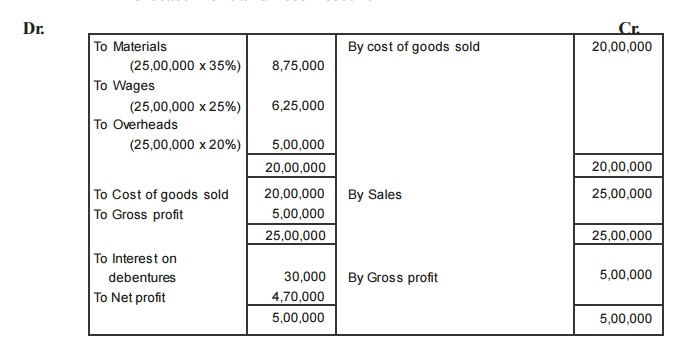
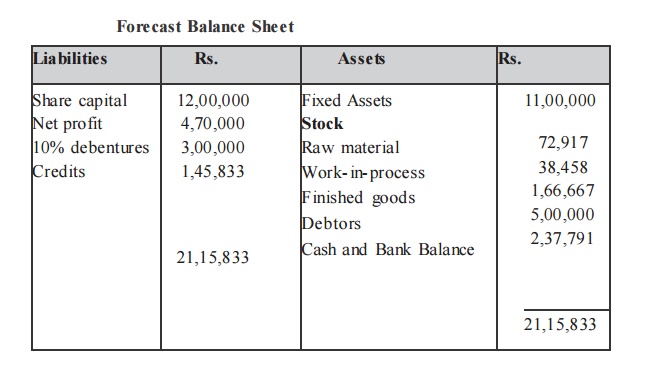
You are required to prepare a statement of working capital requirements, a forecost profit and loss account and balance sheet of the company assuring that
Share Capital Rs. 12,00,000
10% Debentures Rs. 3,00,000
Fixed Assets Rs. 11,00,000
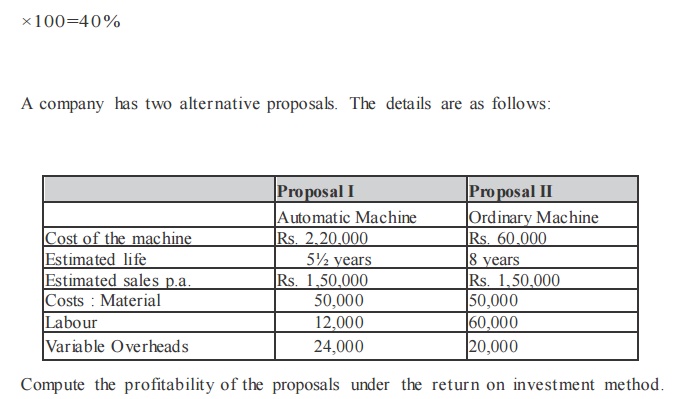
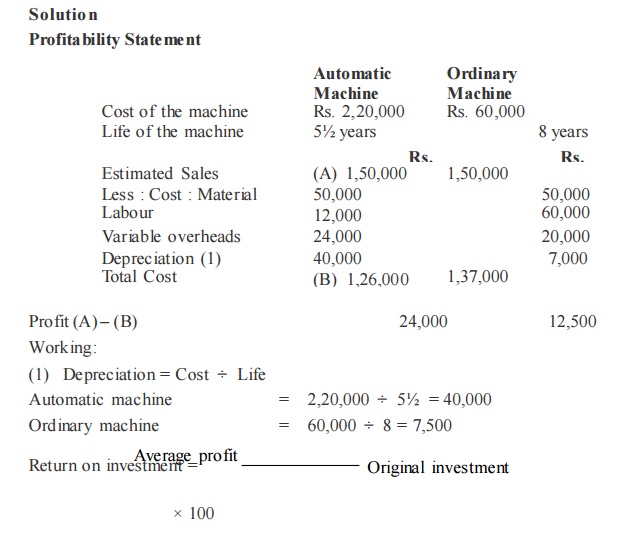
Related Topics