Chapter: Basic Radiology : Brain and Its Coverings
Exercise: Stroke
EXERCISE 12-2.
STROKE
12-3. In Case 12-3, what is the most likely diagnosis (Figure
12-16 A,B)?
A.
Intracranial abscess
B.
Arachnoid cyst
C.
Metastatic brain tumor
D.
Primary brain tumor
E.
Cerebral infarction
12-4. In Case 12-4, what is the likely cause of the patient’s
problem (Figure 12-17 A,B)?
A.
Brainstem infarction
B.
Brainstem compression from cerebellar infarction
C.
Brainstem tumor
D.
Cerebellar astrocytoma
E.
Posterior fossa hemorrhage
12-5. In Case 12-5, what is the most likely diagnosis (Figure
12-18)?
A.
Thalamic glioma
B.
Subarachnoid hemorrhage
C.
Metastatic disease
D.
Hypertensive hemorrhage in the basal ganglia
E.
Cerebral contusion
Radiologic Findings
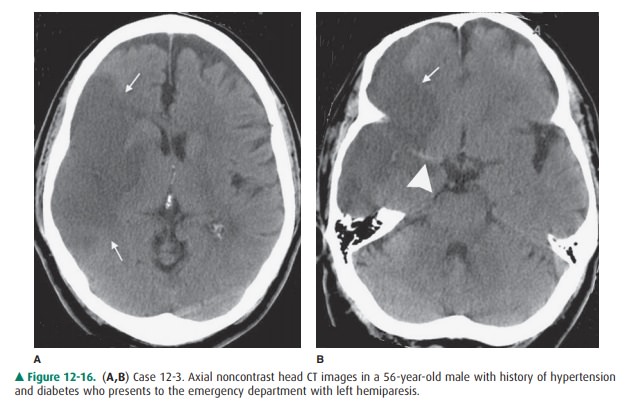
12-3. In this case, the axial CT image (Figure 12-16 A)
demonstrates a well-defined area of hypodensity (white arrows) in the right
middle cerebral artery (MCA) territory. There is secondary mass effect on the surrounding
brain parenchyma with effacement of the cortical sulci. In a more inferior
axial image (Figure 12-16 B), note the bright right MCA (arrow-head)
corresponding to an acute thrombus in the main trunk of this vessel (E is the
correct answer to Question 12-3).
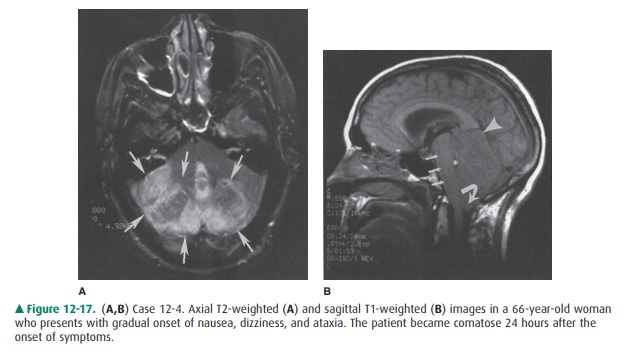
12-4. In this case, the axial T2-weighted MR image (Figure
12-17 A) shows areas of increased T2 signal (arrows) corresponding to edema
within the cerebellum. A sagittal T1-weighted image (Figure 12-17 B) shows a
swollen cerebellum, as well as upward transtentorial (arrowhead) and downward
tonsillar (curved arrow) herniation of cerebellar tissue. Also note
compres-sion of the brainstem (small arrows) and fourth ven-tricle (asterisk).
These changes are compatible with a recent cerebellar infarction with brainstem
compres-sion caused by the swollen cerebellum (B is the cor-rect answer to
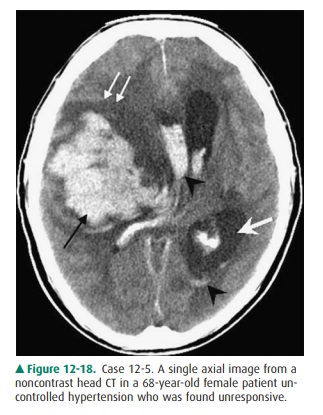
Question 12-4). 12-5. In this
case, an axial CT scan (Figure 12-18) demon-strates a large, hyperdense
intraparenchymal hemor-rhage centered in the right basal ganglia (black arrow)
with surrounding edema and mass effect (double white arrows). Intraventricular
extension of hemorrhage is present (black arrowheads) with en-trapment of the
left lateral ventricle secondary to midline shift (single white arrow). This is
most likely secondary to the patient’s known hypertension (D is the correct
answer to Question 12-5).
Discussion
Stroke is a lay term for
neurologic dysfunction. The usual image of a stroke patient is that of an
elderly individual with hemiparesis, often associated with abnormal speech.
There are actually many different causes of stroke. These include cerebral
infarction, intracerebral hemorrhage, subarachnoid hemorrhage, and
miscellaneous causes such as dural sinus occlusion with associated venous
infarction. Although these conditions may have similar clinical presentations,
they have different treatments and prognoses.
The vast majority of strokes are
cerebral infarctions as-sociated with atherosclerosis. The radiologic
manifestations of cerebral infarction vary with time. The head CT scan of the
patient in Case 12-3 was obtained several days after the onset of symptoms and
shows typical findings of a subacute infarct in a major vascular territory, in
this case, the right middle cerebral artery region. By this time, the infarct
is a very well-defined area of low attenuation compared to nor-mal surrounding
brain. There is associated mass effect from the edematous tissue. Acute
infarcts (less than 24 hours since onset of symptoms) may be difficult to
identify on head CT scans, if at all. However, diffusion-weighted MR imaging
often demonstrates brain abnormalities within hours of symptom onset. Subtle
changes on head CT scans in acute infarction can sometimes be seen, but may be
over-looked if the examination is not closely scrutinized. Some-times the only
apparent change on CT scans is a subtle loss of gray matter/white matter
differentiation in the area of in-farction. CT scanning is performed in acute
cerebral infarc-tion because scans can be quickly obtained, and CT is a very
good test for identifying intracranial hemorrhage, an im-portant finding for
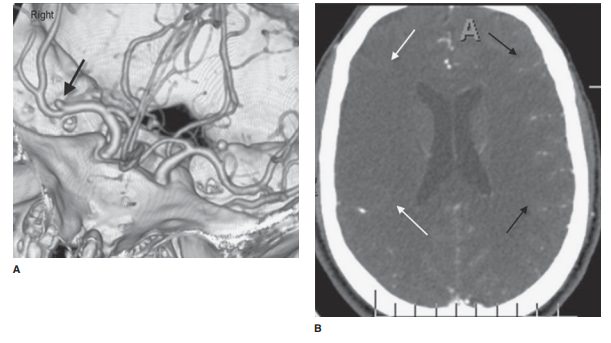
management considerations. Institu-tions that are involved in the early
management of stroke often have a stroke imaging protocol whereby noncontrast
CT is typically obtained along with CT angiography (Figure 12-19 A, B) as well
as CT perfusion. If the infarct is not ob-vious on the initial CT scan, an MR
scan is usually obtained to verify high clinical suspicion.
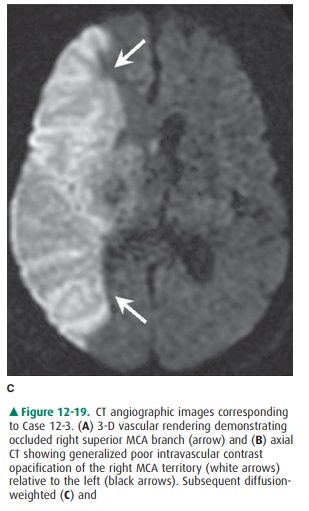
An acute or subacute infarction
will exhibit a diffusion signal abnormality that reflects the restricted
movement of water molecules and typically persists for 1 to 2 weeks within
infarcted tissue (Figure 12-19 C). T2-weighted imagingdemonstrates increased
signal within the infarcted territory due to the presence of cytotoxic edema
(Figure 12-19 D). In-travascular enhancement extending into the cortical sulci
may be seen in the acute to early subacute phase of infarct, generally related
to prolonged intravascular opacification from slow vas-cular flow (Figure 12-19
E). Within several days of a cerebral infarction, parenchymal enhancement is
commonly identified along the cortex, which usually has a bandlike, tubular, or
gyri-form appearance and may persist for several weeks. Solid or ring-enhancing
areas, as well as more amorphous-appearing patterns of enhancement, can
occasionally occur.
Case 12-4 illustrates an
important point to consider when deciding which test to order in the setting of
acute stroke. In this case, the patient’s symptoms were worrisome for a
brain-stem process. CT scanning of the brainstem and posterior fossa is
frequently degraded by streak artifacts emanating from the dense bone of the
skull base. Subtle (and sometimes not so subtle) abnormalities may not be
apparent. Therefore, for most neurologic conditions that involve the brainstem
or posterior fossa, MR scans are much better at depicting an ab-normality.
Notice that the patient in Case 12-4 did not in fact have a brainstem infarct,
as was suspected clinically, but rather had brainstem compression from a large
cerebellar infarct.
Case 12-5 illustrates how
essential an imaging examina-tion is in managing stroke as the patient
initially had signs of cerebral infarction. The CT scan demonstrated an obvious
basal ganglia hemorrhage, probably secondary to the pa-tient’s hypertension.
Management of these two conditions is considerably different. Hypertension is
the main cause of nontraumatic intracranial hemorrhage. In adults, these
hem-orrhages typically occur in the putamen/external capsule. Other locations
for hypertensive hemorrhage include the thalamus, pons, cerebellum, and,
rarely, subcortical white matter. Acute parenchymal hematomas, as in this case,
are usually hyperdense on CT scans. With time these lesions be-come darker and
eventually appear as round or slitlike cavi-ties. The MR imaging appearance of
a parenchymal hematoma is complex and depends largely on the presence of
hemoglobin breakdown products within the clot.
Related Topics