Chapter: Medicine Study Notes : Cardiovascular
ECG Interpretation
ECG Interpretation*
·
Reference: ECG Made Easy, J R
Hampton, Churchill Livingston, 1997. Well worth a read
·
5 mm (one large square) = 0.2
secs Þ 300 squares per minute
Leads
·
Depolarisation:
o R > S: depolarisation spreading toward lead
o R < S: depolarisation spreading away from lead
·
R = S: depolarisation at right
angles to lead
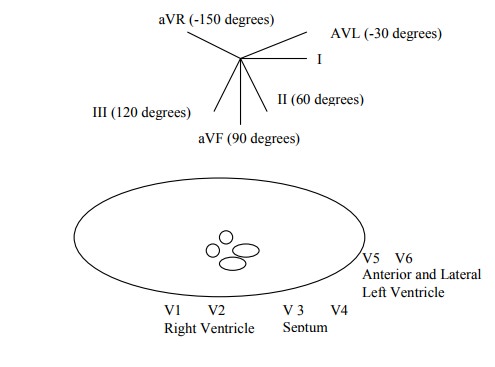
Axis
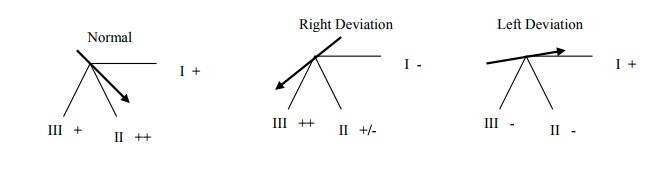
·
To check axis, look at I, II and
III. Normal is between VL and VF
·
Alternative: cardiac axis is at
right angles to lead in which R & S are the same size
·
Right Deviation: ? hypertrophy of
RV or tall and thin.
·
Left deviation: ?hypertrophy of
LV
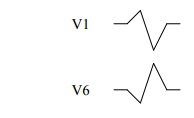
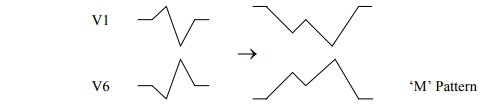
QRS Complex in V Leads
·
Shape is determined by:
o Septum is depolarised first, and the wave spreads from L to R in the
septum:
§ V1 initially up as depolarisation in the septum (L ® R) is
towards the lead
§ V6 initially down as depolarisation in the septum is away from lead
o Muscle mass: LV dominates so V1
is down and V6 is up.
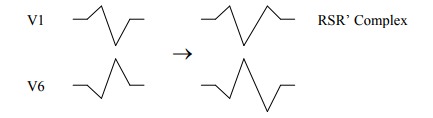
Bundle Branch Block
·
Delay in depolarisation of part
of the muscle ® widened QRS. If QRS > 3 small squares (0.12 secs) Þ slowed
conduction Þ bundle block or ventricular
ectopic beat.
·
Right Bundle Branch Block (Can be
benign. ?Atrial septal defect): Left depolarises first, then right. May just be
delay to the terminal end of QRS (especially in V5)
·
Left Bundle Branch Block. Always
pathological. RV depolarises, then wave spreads to LV. T wave inversion in
anterior and lateral leads is common (I, VL, V4 – V6). Wide QRS
o Left bundle divides into the anterior and posterior fascicles. Failure
of the anterior fascicle ® left axis deviation (depolarisation is through the posterior fascicle)
o If LBBB: ?aortic stenosis, ischaemic disease
·
To determine side of block: W in
V1 and M in V6 is Left (WiLLiam). M in V1 and W in V6 is Right (MaRRow). LBBB prevents any further interpretation of
the ECG
Reporting an ECG
·
Check rate: bradycardia or tachycardia?
·
Check rhythm:
o See also Arrhythmias,
o Regular or irregular
o Sinus rhythm = one P wave per QRS complex Þ
depolarisation begins in SA node.
o Sinus arrhythmia:
§ Bradycardia: athletes, fainting attacks, hypothermia, myxoedema, drugs
§ Tachycardia: exercise, fear, pain, shock, thyrotoxicosis
o Supraventricular arrhythmia:
§ = Sinus, atrial or junctional/nodal arrhythmia
§ QRS is normal width (unless also bundle block)
§ Escape beats are atrial, nodal or ventricular pacemakers that fire if
the SA node fails, as they have a slower intrinsic rate. Escape beats come
late.
·
Atrial escape: abnormal P wave
after SA node fails. Normal QRS
·
Nodal escape: no P wave (either
none or buried in Normal QRS)
·
[Ventricular escape – not
supraventricular: usually in complete heart block. Fast P waves. Slow wide QRS.
Shape of QRS may vary.]
§ Extrasystole/ectopic beats come early – some part of the heart has
depolarised prematurely
o Distinguish Ventricular Tachycardia and supraventricular tachycardia
with bundle branch block:
§ Both have wide QRS
§ But Supraventricular Tachycardia has P waves (check all leads). Compare
QRS with normal QRS – if similar then bundle block.
o Wolff-Parkinson-White Syndrome (a type of ventricular pre-excitation):
Accessory conducting bundle, usually to LV ® short PR and QRS has abnormal
slurred upstroke (delta wave)
o Treatments:
§ Atrial Fibrillation: Digoxin
§ Junctional Tachycardia: Carotid sinus pressure then adenosine
§ Atrial Flutter: Carotid sinus pressure, adenosine, flecainide, DC
conversation
§ Ventricular Tachycardia: lignocaine, DC conversion
·
Check Cardiac Axis
·
Check P wave: shape:
o Normal is < 2 * 2 small squares
o Right atrial hypertrophy (eg tricuspid stenosis) ® peaked P
o Left atrial hypertrophy (eg mitral stenosis) ® broad,
twin-peaked P, especially in II, III, aVF
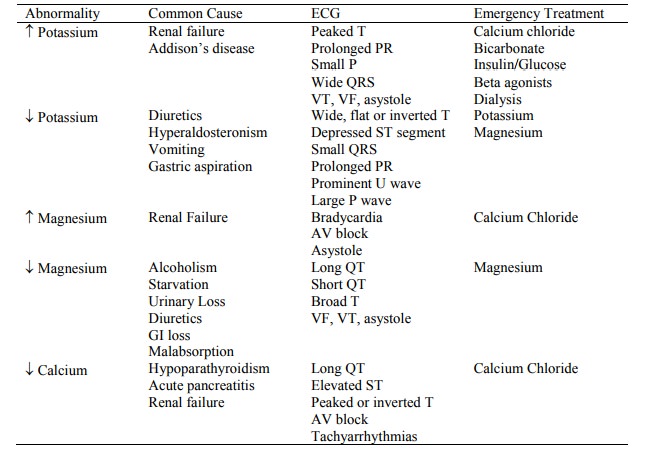
o Potassium: ¯K ® P, K ® ¯P
·
Check conduction intervals - PR interval:
o From beginning of P wave to beginning of QRS = time for AP to spread
from SA node to ventricular muscle.
o Normal is 0.12 – 0.2 sec. (3 – 5 small squares)
·
Description of QRS Complex. Width of QRS complex = time for AP to spread
through ventricles:
o Normal is <= 0.12 sec. (3 small squares)
o Height Þ muscle
mass
o Right Ventricular Hypertrophy:
§ V1: R becomes higher (> 25 mm)
§ V6: S becomes deeper
§ Also look for:
·
Right axis deviation
·
Peaked P (right atrial
hypertrophy)
·
Inverted T in V1 – V3
§ This picture is similar to a PE (which also has a Q wave in III)
o Left Ventricular Hypertrophy:
§ V1: deep S wave
§ V6: Tall R wave (> 25 mm)
§ Inverted T wave in II, VL, V5 and V6
§ Left axis shift
o Q waves:
§ Negative wave at start of QRS
§ If > one small square wide and > 2 mm deep Þ patch of
non-active muscle in the wall and the lead is „looking inside‟ the heart, not
at the wall Þ old MI. Usually permanent
§ Anterior/septal infarct Þ Q wave in V2, V3 and V4 (Left anterior descending artery)
§ Anterior-lateral infarct Þ Q waves in I, II, VL. V3 – V6
(Left circumflex)
§ Lateral infarct Þ Q wave in I, V5, V6
§ Inferior infarct Þ Q wave in II, III and VF (Þ right coronary artery)
§ Inferior-lateral Þ Q wave in II, III, aVF, V5, V6
o Bundle Branch Block
·
Description of ST segments:
o If raised Þ acute injury – recent MI or pericarditis. Anterior Þ V5, V6. Inferior Þ III and VF
o Depression Þ ischaemia not infarction
·
T wave:
o Normally inverted in aVR and V1 (also V2 in young people and V3 in
blacks)
o If not full thickness infarct Þ T wave inversion but no Q wave
(no „window‟ into heart) Þ non-Q wave infarction
o If abnormal QRS Þ abnormal T of no significance (repolarisation also skewed)
o Digoxin ® T wave inversion and sloping depression of the ST segment
o Electrolyte imbalances:
§ ¯K ® T wave
flattening
§ K ® tall,
wide peaked T waves
·
QT interval
o ¯Ca ® QT
interval
o Ca ® ¯QT
interval
·
Progression following MI:
o Elevation of ST
o Q waves appear
o T becomes inverted – may be permanent
ECG Abnormalities Due to Electrolyte Disturbances
Related Topics