Chapter: Introduction to Human Nutrition: Body Composition
Doubly indirect methods - Body composition techniques
Doubly indirect methods
Anthropometry
Weight/height indices
A weight/height index aims to correct body weight for height. As a measure of body composition, for example body fat, a weight/height index should have a high correlation with body fat, but also a low cor-relation with body height, otherwise in short people body fat would be systematically overestimated or underestimated.
In the literature, a number of weight/height indices have been proposed. Examples are the Quetelet index or body mass index (BMI: weight/height2), the Broca index [weight/(height – 100)], and the Benn index (weight/heightp, in which the exponent p is popula- tion specific). The Quetelet index or BMI is the most widely used index today. Its correlation with body fat is high (depending on the age group r = 0.6–0.8) and the correlation with body height is generally low. The World Health Organization (WHO) promotes the BMI as a crude indicator for weight judgment. In Table 2.5 the cut-off points for underweight, normal weight, overweight, and obesity according to the WHO are given. These cut-off values are based on the relation of BMI with mortality and with risk factors for disease as found in Caucasian populations. For non-Caucasian populations other cut-off values may apply (WHO, 2004).
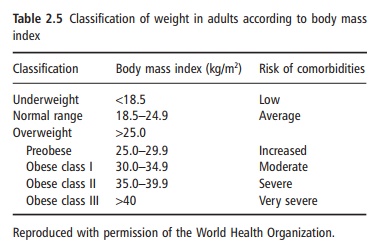
The cut-off values for BMI as in Table 2.5 cannot be used in children. In younger children, weight com-pared with height is relatively low, and so is the BMI. During growth, the increase in weight is larger than the increase in height and, consequently, the BMI increases with age during the pubertal phase of life. There are age-related BMI cut-off values for obesity for children.
The BMI can also be used as a predictor for the percentage of body fat. Several studies have been pub-lished in which a good relationship between the BMI and the amount of body fat (either as fat mass or as body fat percentage) was demonstrated. The relation-ship between BMI and body fat percentage is age and gender dependent and is different among certain ethnic groups. When using such age- and gender-specific prediction equations, body fat per-centage can be predicted with an error of 3–5%. This error is similar to the prediction error of other doubly indirect methods, for example skinfold thickness or total body bioelectrical impedance measurements. The disadvantage of these prediction formulae is that they obviously cannot be used in certain subjects or groups of subjects such as pregnant women or body-builders. However, other predictive methods also have their limitations in these subjects.
TBW can also be predicted from weight and height, and numerous prediction formulae have been pub-lished. The standard error of estimate of these equa-tions is, however, considerable.
Skinfold thickness measurements
Body fat is located both internally and subcutane-ously. If one assumes a constant relationship between subcutaneous fat and total body fat, then total body fat can be estimated by measuring the amount of the subcutaneous adipose tissue. The amount of subcu-taneous tissue can be estimated by measuring the thickness of the subcutaneous fat layer at different sites of the body using a skinfold caliper, infrared interactance, or ultrasound measurements. In a given age group, the relation between subcutaneous fat and total fat is indeed relatively constant. However, the relationship is different between males and females, females having relatively more internal fat. Thus, it is possible by using age- and gender-specific prediction equations to assess the total amount of body fat by measuring skinfolds at different sites of the body.
Skinfolds can be measured all over the body. The most often measured skinfolds for the assessment of total body fat are skinfolds on the upper arm biceps
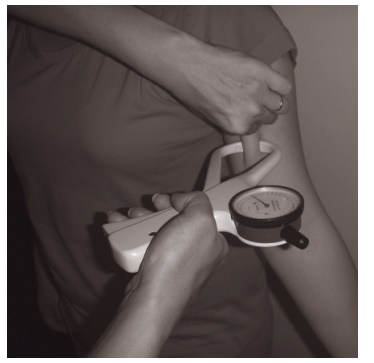
Figure 2.5 Measurement of the biceps skinfold.
(Figure 2.5) and triceps, under the scapula (subscapu-lar) and above the iliac crest (suprailiac). The sum of more skinfolds is normally used to reduce the error in measurement and to correct for possible differ-ences in subcutaneous body fat distribution between subjects within the same age and gender group. Various prediction formulae for body fat from skin-fold thickness have been published. For children, in whom the relationship between skinfold thickness and body fat depends on biological age, separate for-mulae must be used.
Measuring skinfolds adequately requires a trained and experienced observer, otherwise excessively large errors in the assessment of the body fat can occur. A disadvantage of the method is that the subject has to be partly undressed. This hampers the use of the method in epidemiological studies. In bed-ridden or seriously ill patients the measurement of the trunk
This can be over-come by measuring only the skinfold thickness at the upper arm, for example the triceps. However, the error can be large because the triceps does not neces-sarily represent the total amount of subcutaneous fat. With advancing age, the triceps skinfold becomes less representative of total body fat.
In elderly subjects, the correlation between skin-fold thickness and total body fat as measured by densitometry is generally lower than in young and middle-aged adults. This is due to an increased amount of internal fat in the elderly. Obese subjects are difficult to measure and the error is large even when measured by trained observers. This is also the case in subjects with edema, in whom the thickness of the subcutaneous adipose tissue is easily overesti-mated. In patients with human immunodeficiency virus (HIV) lipodystrophy, peripheral subcutaneous fat may be almost absent, while abdominal fat is increased. In this situation, skinfolds can be very mis-leading as indicators of total body fat, and should be used only to assess regional fat.
The calculation of the body fat percentage once the skinfolds have been measured is very simple. For a given skinfold thickness, the amount of body fat can be read from a table (Table 2.6).
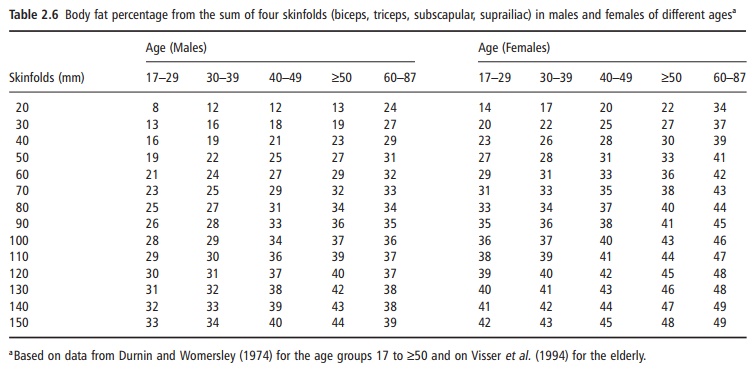
The prediction error in body fat percentage is 3–5% compared with densitometry, depending on age, gender, and level of body fatness. Given the possible error in densitometry (3%), this means that in extreme cases body fat from skinfolds can be as much as 10– 15% off.
Other anthropometric variables
Measurements of widths of skeletal diameters provide an indication of the amount of skeletal mass. There are formulae that allow the calculation of the skeletal mass from body height, wrist diameter, and knee diameter. The current reference data for ideal weight in the USA use the elbow diameter to classify people into three types of body build.
In elderly subjects, the measurement of stature can be difficult owing to kyphosis and/or shrinkage of the spinal vertebrae. Knee height can then be used to predict the maximal stature during lifetime. Arm span is also used for that purpose. However, one has to realize that the current prediction formulae are developed in younger populations, in which the rela-tionship between stature and surrogate measure-ments may be different. In addition, the prediction error (3–5 cm) is relatively high. Knee height can also be used by itself (without predicting total stature), when comparing stature-adjusted body composition between young and old people.
Circumferences of the extremities or the trunk are used to obtain information on body composition.
From the mid-arm circumference, in combination with the triceps skinfold thickness, information on muscle mass and fat mass of the upper arm can be obtained. Circumferences of the trunk at waist, hip, and upper thigh level are used as indicators of body fat distribution. The WHO suggests an upper limit waist-to-hip circumference ratio above 0.85 for females and 1.00 for males for abdominal fat distribu-tion. Diameters can also be used to gain insights into body fat distribution. A high sagittal diameter com-pared with transverse diameter of the abdomen is indicative of an enlarged amount of visceral fat. However, it has to be kept in mind that the relation-ship between these anthropometric parameters of body fat distribution and the intra-abdominal fat determined by CT or MRI scan is generally low. Changes in internal fat detected by MRI are only weakly associated with changes in these anthropo-metric parameters of fat distribution.
Infrared interactance
The principle of infrared interactance is based on differences in absorbance and reflection of infrared light in different tissues. When the absorbance of near-infrared light (700–1100 nm) is measured at well-defined sites of the body, information on the thickness of the subcutaneous adipose tissue layer can be obtained. In the prediction formulae used, many other parameters are included, such as weight, height, age, and gender, and it has been argued that the prediction of body fat depends more on these parameters than on the measured infrared interaction.
Ultrasound measurements
Ultrasound measurements can also be used to study several aspects of body composition. With ultrasound measurements, the thickness of the subcutaneous fat layer can be determined and total body fat can be calculated. A good reflection signal depends heavily on the absence of connective tissue between adipose tissue and muscle. The main difficulty in ultrasound measurements is the exact application of the ultra-sound transducer perpendicular to the tissue without any pressure. In the literature, several studies report a good correlation between skinfold thicknesses mea-sured by calipers and those measured by ultrasound. The correlation of skinfolds with total body fat was higher than when using ultrasound, suggesting that skinfold thickness measurements have a better pre-dictive value.
Internal abdominal body fat can also be assessed with ultrasound. Studies have shown that ultrasound measurements provide a better method than anthro-pometry to assess internal abdominal fat depots.
Bioelectrical impedance
In bioelectrical impedance, a small alternating current is applied to the body. It is assumed that the body consists of different components, of which water and dissolved electrolytes are able to conduct the current. Hence, body impedance is a measure of body water. The electrical resistance or impedance of an electro-lyte solution depends on several factors, of which the most important are the amount of electrolytes (pure water does not conduct the current), the kind of electrolytes, and the temperature of the solution. If currents of low frequency (<5 kHz) are used, body impedance is a measure of ECW, as a low-frequency current cannot penetrate the cell membrane, which acts, with its layers of protein, lipids, and proteins, as an electrical capacitor. With increasing frequencies the capacitor features of the cell membrane diminish and gradually ICW also participates in the conduc-tance of the current, resulting in lower impedance values at higher frequencies. Hence, at higher fre-quencies, TBW is measured. TBW and ECW can be predicted from impedance at high and low frequency, respectively, using empirically derived prediction for-mulae. Other parameters are often taken into consid-eration, such as body weight, age, and gender.
Most prediction equations are based on statistical relationships between empirically measured im-pedance index values (height2/impedance) and body water values obtained by dilution techniques such as deuterium oxide dilution (for TBW) and bromide dilution (for ECW). As body water in healthy subjects is an assumed fixed part (73%) of the FFM, bioelectri-cal impedance measurements can also be used for the prediction of the FFM and hence body fat percentage. For those prediction equations, the impedance index was related to measures of FFM, normally obtained by densitometry or by DXA.
Body impedance depends on the frequency of the current used and on body water distribution between the extracellular and intracellular space and between the different geometrical body compartments (legs, trunk, and arms). This calls for extreme caution in the interpretation of calculated body composition values in situations where body water distribution can be disturbed, as is the case, for example, in dialysis patients and in ascites. In general, prediction formulae based on impedance values are strongly population specific, and age and gender are important contribu-tors. Differences between populations and individuals are partly caused by differences in body build (e.g., relatively long legs), which is not surprising, as the legs contribute most to total body impedance relative to other parts of the body.
Currently available impedance analyzers vary in their electrical features and in their principles. Many companies have developed impedance analyzers for personal use, anticipating considerable interest among the public in determining their body fat per-centage. There are instruments that measure imped-ance from foot to foot while standing on a weighing scale and provide not only body weight but also body fat percentage. Other instruments measure imped-ance from hand to hand and allow the reading of body fat percentage, using a built-in software program in which weight, height, age, and gender have to be entered. Combinations of foot-to-foot and hand-to-hand impedance analyzers are also marketed.
As for all other impedance analyzers, the incorpo-rated formulae are population specific and have a prediction error of 4–5%. This means that, apart from a systematic error (prediction formula is not valid), the value can be as much as 10% off in extreme cases. This kind of error is similar to the possible error in skinfold thickness measurements, and hence impedance is no better than skinfold thickness mea-surements. The advantage of impedance analyzers is that there is no need to undress and measurements are less prone to observer bias.
Total body electrical conductivity
Total body electrical conductivity (TOBEC) was devel-oped in the 1970s. The principle of the method is that conductive material (body water and dissolved elec-trolytes) that is placed in an electromagnetic field will cause an inductive current, which is related to the amount of conductive material. In practice, the subject lies on a stretcher, which enters the inner space of an electric wire coil, through which a high-frequency current (2.5–5 MHz) passes. The measurement is very quick (it takes only seconds), painless, and without any risk to the subject. The reproducibility of a mea-surement is within 2% and the error in the predicted FFM was found to be about 3 kg in a group of adult subjects, which is similar to, for example, skinfold thickness measurements or impedance measurements. The TOBEC method is especially suitable for mea-surements in infants and young children, in whom bioelectrical impedance measurements are difficult or impossible to perform, owing to movement. The main disadvantage of the method is the high price.
Creatinine excretion and N-methyl-histidine excretion
In the muscle cell, creatine phosphate, necessary for the energy metabolism of the cell, degenerates to cre-atinine at a constant daily rate of about 2%. It is assumed that 1 g of excreted creatinine is equivalent to 18–22 kg of muscle mass. As the cell cannot recycle creatinine, the kidneys excrete it. Since metabolized creatine phosphate is not the only source of urinary creatinine (e.g., creatinine in ingested meat is also excreted immediately), the validity of the method is dubious. A day-to-day coefficient of variation in the excretion of creatinine of almost 20% is reported, when the subject is “free living” and the urine is sampled over constant periods of 24 hours. The high variation is due to the ingestion of creatinine with nonvegetarian meals, differences in physical activity levels, and variation in creatinine excretion within the phase of the menstrual cycle. After careful standard-ization, which includes a controlled diet, the day-to-day variability in excretion can be decreased to about 5%. To obtain a reliable assessment of the creatinine excretion, sampling of urine over multiple 24 hour periods is necessary.
The excretion of 3-methylhistidine has also been proposed as a measure for muscle mass. FFM deter mined by densitometry correlates well with excreted 3-methylhistidine. The chemical determination of 3-methylhistidine is, however, more complicated than that of creatinine. A unique feature of 3-methylhistidine is that it gives a measure of muscle protein breakdown. Given the greater expense of measuring 3-methylhistidine and the limited benefit for muscle mass estimates, it is probably best to use it primarily for turnover studies.
The main disadvantages of creatinine and 3-methylhistidine excretion as measures for body com-position are the large variability in excretion, the necessity to follow a controlled (meat-free) diet for several days before and during the urine collections, and the difficulties associated with collecting 24 hour urine samples.
Use and misuse of body composition data
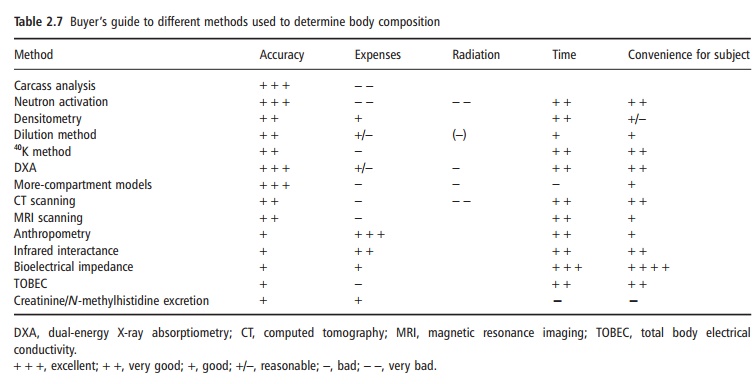
Information on the body composition of groups of subjects or individuals is important, as body compo-sition is an indicator of nutritional status and also provides information about acute water homeostasis. Depending on what information is needed, several methods are available. However, all have their advan-tages and limitations. The price of the method (both the instrument and the required personnel), the eventual stress and danger (e.g., radiation) for the subject, and the time necessary to obtain the informa-tion determine the choice of the method, as well as the required accuracy. The use in epidemiological studies is different than that in clinical situations or in physiological research. Table 2.7 provides a “buyer’s guide” to the several methods discussed. It is difficult to generalize as to which method should be used in a given study. Apart from the factors mentioned in Table 2.7, availability plays an important role. Some situations are discussed below.
For the description of body fatness of a large general population group, the calculation of the body fat per-centage from the BMI may be as good as or even better than the more expensive information obtained from bioelectrical impedance or the laborious mea-surement of skinfold thicknesses. Whichever method is to be used for the prediction of body fat percentage in the population, it is important to remember that the formulae used should have been validated in the population under study. The fact that a formula is cross-validated by the authors who published the formula does not mean that the formula is valid in another population. The use of the Durnin and Womersley (1974) equations for estimating body fat from the sum of four skinfolds may be correct if the population is adult but younger than about 60 years. In older subjects, the amount of body fat is likely to be underestimated with these formulae. Therefore, their use and thoughtless interpretation in the elderly would lead to completely wrong conclusions about body composition in the elderly and changes in body composition with age. For the same reason, the BMI as an indicator of body fatness is only suitable when corrections for age and gender are made; for example, a BMI of 25 kg/m2 at the age of 20 years reflects a much lower percentage of body fat than at the age of 70 years. Body fat in females is always higher than body fat in males with the same BMI and age. Recent studies have shown that the relationship between BMI and body fat percentage also differs among ethnic groups. Figure 2.6 gives a good insight on how misleading a low BMI can be. The biodata also show the differences in body build, which is at least part of the reason for the paradox. Prediction equations based on impedance are dependent on body build, among other factors, and there are no universally valid prediction equations based on impedance. Choice of method to assess body composition in a population would also take into consideration within-and between-observer variability. Thus, impedance may be better than skinfold thickness measurements in a study of 1000 people, where variability between technicians is important. One may argue that, for population studies, a slight overestimation or under-estimation of body fat is not important. However, if, for example, obesity is defined as a certain amount of body fat that is achieved at a certain distinct level of BMI, even minor differences in body fat percentage or in BMI will result in large differences in the preva-lence of obesity.
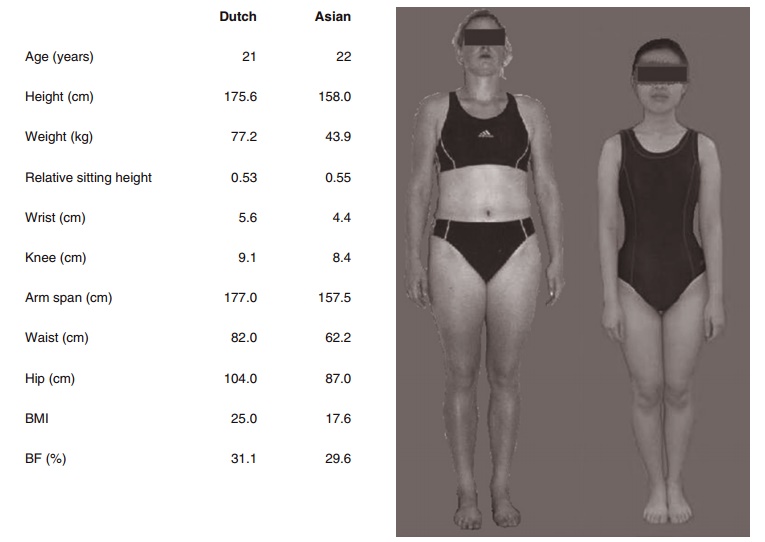
Figure 2.6 The difference in the relationship between BMI and body fat percentage across populations is best demonstrated in this figure and the given biodata. Note that the two young women are the same age and their percentage body fat as determined by a chemical four-compartment model (bias free!) is the same. The Asian woman has relatively shorter legs and a more slender body build (determined as height/(sum of knee and wrist diameter). Relative leg length and “slenderness” are main determining factors in the BMI/percentage body fat relationship in addition to physical activity level.
In physiological studies where, for example, energy metabolism has to be corrected for body composition, a systematic bias in body composition results may lead to completely wrong conclusions. When a body composition formula or method sys-tematically overestimates the FFM in obese subjects, a “normal” resting metabolic rate in obese subjects would be underestimated after “correction” for dif-ferences in body composition (expressed as kJ/kg FFM). This may lead to the conclusion that obese subjects have lower metabolic rates, which might have caused their excess adipose tissue stores. This argument does not even imply whether the FFM can be treated as one entity in different populations instead of different components such as the heart, liver, or muscles (Gallagher et al., 1998). These con-siderations are important for comparative studies between groups (e.g., obese versus nonobese, elderly versus young or middle-aged), but also for longitudi-nal studies (e.g., weight-loss studies).
The use of bioelectrical impedance to predict changes in FFM, TBW, or body fat during weight loss is questionable. The difference in body water distri-bution (anatomically as well as intracellular/extracel-lular) before and after weight loss may be considerable, leading to a different and systematic bias of the pre-diction equation. In such a study it may be better to report changes in impedance values instead of changes in predicted body composition. Another example is the very low change in impedance after water removal in patients with ascites. Despite the fact that a consid-erable amount of water is removed from the body, the change in total body impedance is low as the trunk hardly contributes to total body impedance.
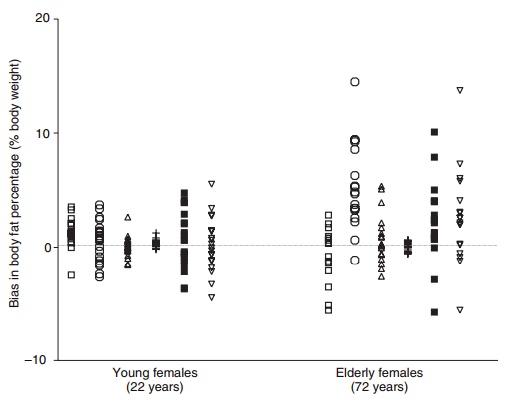
All methods have their limitations, doubly indirect more than indirect methods. Figure 2.7 shows the individual errors in body fat percentage from den-sitometry, DXA, deuterium dilution, a chemical three-compartment model, skinfold thicknesses, and bioelectrical impedance in young and elderly women compared with body fat percentage obtained from a four-compartment model. It is obvious that errors can be considerable, both at a group level and espe-cially at an individual level in the elderly. Many of these errors can be explained by the violation of assumptions. This clearly shows that information on body composition must be used with an awareness of the limitations of the techniques.
Related Topics