Chapter: Pharmaceutical Drug Analysis: Errors In Pharmaceutical Analysis and Statistical Validation
Comparison of Results
COMPARISON OF RESULTS
In a situation where the same sample has been analysed by
two separate techniques altogether, each of them repeated several times, and
that the mean values obtained are not the same ; statistically it may be
possible to ascertain whether the analytical procedure adopted has been either
accurate and precise or if it is superior to one of the two methods.
In fact there are two frequently employed methods that
may be used to compare the results, namely :
(a) Student’s t-Test, and
(b)
Variance-Ratio Test (or F-Test).
In order to perform these two tests one should have a
clear understanding of the statistical term ‘the number of degrees of freedom’.
Degrees of Freedom : It is the number of individual
observations which can be allowed to vary under conditions that the mean ( x
) and standard deviation(s), once determined, be held constant.
![]()
Thus, a sample having n values have n degrees
of freedom, whereas the sum Σ(x – x’ )2 is
considered to have n – 1 degrees of
freedom, because for any defined value of the mean, x’ , only n – 1 value can
be assigned freely, as the nth is
being defined from the other values automatically.
![]()
![]()
1. Student’s t-Test
It is usually employed for small samples only. It serves two main objectives, namely :
(i) It is
employed to test the difference between the means of two sets of data x1 and x2
, and
(ii) It is used
to compare the mean obtained from a sample having certain standard value and to
express certain degree of confidence in the significance of the comparison.
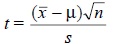
The value of t
may be obtained from the following expression :
 ........................(i)
where, x’ = Mean value,
![]()
μ = True value,
s = Standard deviation, and
n = Degree of Freedom.
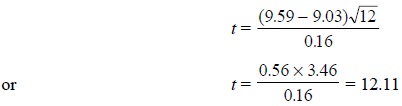
Example : If x the mean of 12
determinations = 9.59, and µ the true value = 9.03, find
out whether or not this result is significant provided the standard
deviation(s) is 0.16.
![]()
From the above Eq. (i)
we have :
Now, from the t-tables
for (n – 1 i.e., 12 – 1 =) 11 degrees of freedom we have :

Evidently, the calculated value for t is 12.11 and the result is highly significant. Besides, the t-table also gives the information that
the probability of obtaining the difference of 0.56 between the experimental
and the true result comes out to be less than 1 in 100, which obviously is
indicative of the fact that some kind of bias does exist in the laboratory
method adopted.
2. Variance-Ratio Test (or F-Test)
A test that makes use of the ratio of the variances of
two sets of results to determine if the standard deviations (s) are significantly different. Its
application may also be extended to compare precisely the results obtained
either from two different laboratories or from two different analytical
procedures.
It is simply calculated from the following equation :
 ...................(ii)
where, s1 and
s2 = Standard
deviations of two sets of results.
Various steps invoived to determine F-Test are
(i) Find the
ratio from Eq. (ii),
(ii) Place the
larger s-value in the numerator so
that F > 1,
(iii) Check for
its significance against values in the F-table, and
(iv) If the
F-value in the table is less than the calculated F-value, then the two standard
deviations are significantly different ; otherwise, they are not.
Example : A sample of anhydrous sodium
carbonate (Na2CO3) is analysed by two different methods which give the results for the
percentage of Na2CO3 as follows :
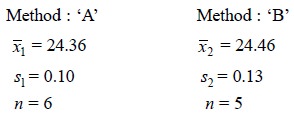
Is there any significant difference between the precision
of these two sets of results ?
Applying the variance-ratio or F-Test from Eq. (ii) we have :
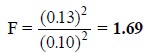
From the standard table having F-values at the 95%
probability level, under column n – 1
= 4 (since s2 >sl ) and row n – 1 = 5, find F = 6.39. Because, 6.39
> 1.69, the standard deviations are not significantly different [see step (iv)
above].
Related Topics