Chapter: Modern Analytical Chemistry: Evaluating Analytical Data
Characterizing Measurements and Results
Characterizing Measurements and Results
Let’s begin by choosing a simple quantitative problem requiring a single measure- ment. The question to be answered
is—What is the mass of a penny?
If you think about how we might answer
this question experimentally, you will realize
that this problem is too broad.
Are we interested in the mass
of United State
pennies or Cana- dian pennies, or is the difference in country of importance? Since
the composition of a penny probably
differs from country
to country, let’s limit our problem to pennies
minted in the United States.
There are other
considerations. Pennies are minted at several locations in the United States
(this is the meaning of the letter,
or absence of a
letter, below the date stamped
on the lower right corner
of the face of the coin).
Since there is no reason
to expect a difference between
where the penny
was minted, we will choose to ignore this consideration. Is there a reason to expect a difference
between a newly minted penny
not yet in circulation, and a penny
that has been in
circulation? The answer
to this is not obvious.
Let’s simplify the problem by narrow-
ing the question to—What is the mass of an average United States penny in circula- tion? This is a problem that we might
expect to be able to answer experimentally.
A good way to begin the analysis
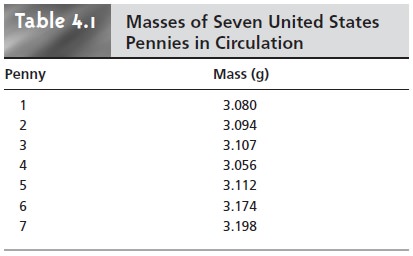
is to acquire some preliminary data. Table 4.1 shows experimentally measured masses
for seven pennies from my change jar at home.
Looking at these
data, it is immediately apparent
that our question
has no simple answer.
That is, we cannot use the mass of a single penny
to draw a specific
conclusion about the mass of any other
penny (although we might conclude
that all pennies weigh at least 3 g). We can, however, characterize these data by providing a measure
of the spread of the individual measurements around a central
value.
Measures of Central Tendency
One
way to characterize the data in Table 4.1
is to assume that the
masses of indi- vidual pennies are scattered around a central
value that provides
the best estimate
of a penny’s true mass. Two common ways to report this estimate
of central tendency are the mean and the median.
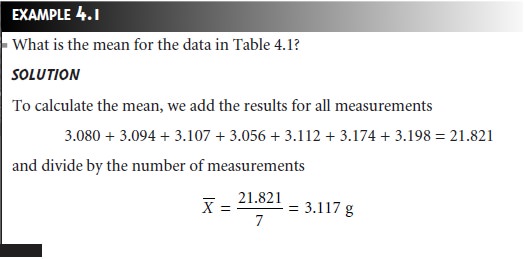
Mean
The mean, X–, is the
numerical average obtained by dividing the sum of the individual measurements
by the number of measurements
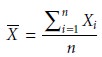
where Xi is the ith measurement, and n is the number of independent measurements.
The mean is the most
common estimator of central tendency. It is not
consid- ered a robust
estimator, however, because
extreme measurements, those
much larger or smaller
than the remainder of the data,
strongly influence the mean’s value.2 For example,
mistakenly recording the mass of the fourth penny as 31.07 g instead
of 3.107 g, changes the
mean from 3.117
g to 7.112 g!
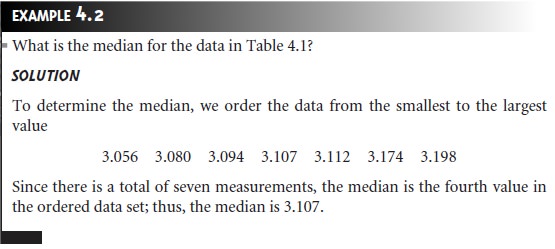
Median
The median, Xmed, is the middle value when data are ordered from the
smallest to the largest value.
When the data include an odd number
of measure- ments, the median is the middle value. For an even number of measurements, the median is the average
of the n/2 and the (n/2) + 1 measurements, where n is the number of measurements.
As shown by Examples 4.1 and 4.2, the mean and median provide similar
esti- mates of central
tendency when all data are similar in magnitude. The median,
however, provides a more robust
estimate of central
tendency since it is less sensi-
tive to measurements with extreme
values. For example,
introducing the transcrip- tion error discussed earlier
for the mean only changes
the median’s value
from 3.107 g to 3.112 g.
Measures of Spread
If
the mean or median provides an estimate of a penny’s
true mass, then
the spread of the
individual measurements must provide an estimate of the variability in the masses
of individual pennies.
Although spread is often defined
relative to a specific measure
of central tendency,
its magnitude is independent of the central
value. Changing all measurements in the same
direction, by adding
or subtracting a constant value, changes the mean or median, but
will not change
the magnitude of the spread.
Three common measures of spread are
range, standard deviation, and variance.
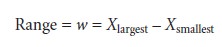
Range
The
range, w, is
the difference between
the largest and smallest values
in the data set.
The range provides
information about the total variability in the data set, but does
not provide any information about
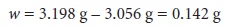
the distribution of individual measurements. The range for the
data in Table
4.1 is the
difference between 3.198
g and 3.056 g; thus
Standard Deviation
The
absolute standard
deviation, s, describes the spread of individual measurements about the mean and is given
as
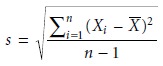
where Xi is
one of n individual measurements, and
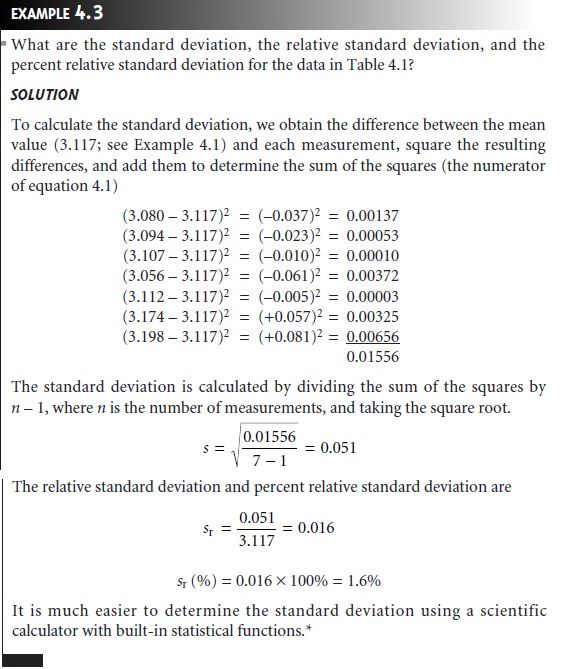
X is the mean. Frequently, the
relative standard deviation, sr,
is reported.

The percent relative standard
deviation is obtained by multiplying sr
by 100%.
Variance
Another common measure
of spread is the square of the standard devia- tion, or the variance. The
standard deviation, rather
than the variance, is usually re- ported because the units for standard
deviation are the same as that for the mean value.

Related Topics