Chapter: Medical Physiology: The Normal Electrocardiogram
Characteristics of the Normal Electrocardiogram
Characteristics of the Normal Electrocardiogram
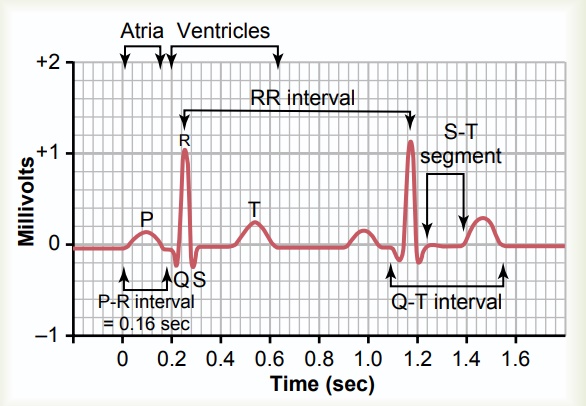
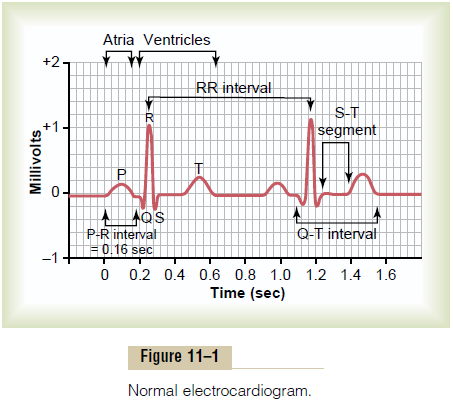
The normal electrocardiogram (see Figure 11–1) is composed of a P wave, a QRS complex, and a T wave. The QRS complex is often, but not always, three separate waves: the Q wave, the R wave, and the S wave.
The P wave is caused by electrical potentials generated when the atria depo-larize before atrial contraction begins. The QRS complex is caused by poten-tials generated when the ventricles depolarize before contraction, that is, as the depolarization wave spreads through the ventricles. Therefore, both the P wave and the components of the QRS complex are depolarization waves.
The T wave is caused by potentials generated as the ventricles recover from the state of depolarization. This process normally occurs in ventricular muscle 0.25 to 0.35 second after depolarization, and the T wave is known as a repolar-ization wave.
Thus, the electrocardiogram is composed of both depolarization and repo-larization waves. The distinction between depolarization waves and repo-larization waves is so important in electrocardiography that further clarification is needed.
Depolarization Waves Versus Repolarization Waves
Figure 11–2 shows a single cardiac muscle fiber in four stages of depolarization and repolarization, the color red designating depolarization. During depolar-ization, the normal negative potential inside the fiber reverses and becomes slightly positive inside and negative outside.
In Figure 11–2A, depolarization, demonstrated by red positive charges inside and red negative charges outside, is traveling from left to right. The first half of the fiber has already depolarized, while the remaining half is still polarized. Therefore, the left electrode on the outside of the fiber is in an area of nega-tivity, and the right electrode is in an area of positivity; this causes the meter to record positively. To the right of the muscle fiber is shown a record of changes in potential between the two electrodes, as recorded by a high-speed recording meter. Note that when depolarization has reached the halfway mark in Figure 11–2A, the record has risen to a maximum positive value.
In Figure 11–2B, depolarization has extended over the entire muscle fiber, and the recording to the right has returned to the zero baseline because both elec-trodes are now in areas of equal negativity. The com-pleted wave is a depolarization wave because it results from spread of depolarizationalong the muscle fiber membrane.
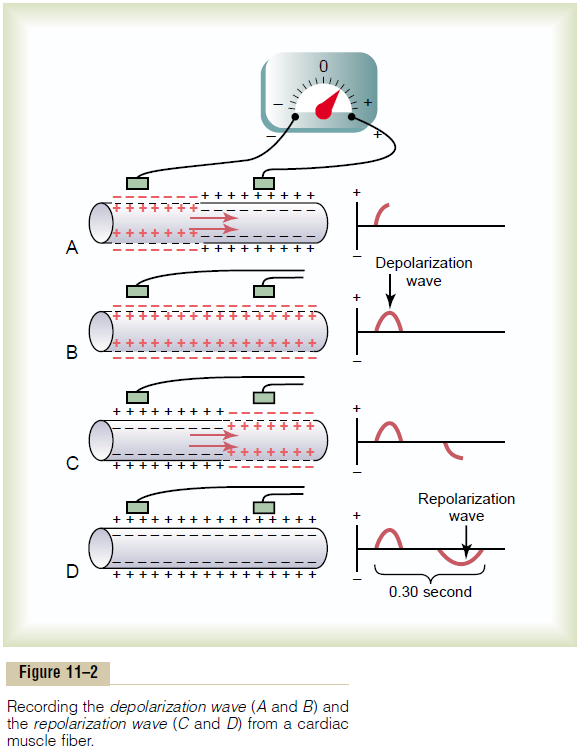
Figure 11–2C shows halfway repolarization of the same muscle fiber, with positivity returning to the outside of the fiber. At this point, the left electrode is in an area of positivity, and the right electrode is in an area of negativity. This is opposite to the polarity in Figure 11–2A. Consequently, the recording, as shown to the right, becomes negative.
In Figure 11–2D, the muscle fiber has completely repolarized, and both electrodes are now in areas of positivity, so that no potential difference is recorded between them. Thus, in the recording to the right, the potential returns once more to zero. This completed negative wave is a repolarization wave because it results from spread of repolarization along the muscle fiber membrane.
Relation of the Monophasic Action Potential of Ventricular Muscle to the QRS and T Waves in the Standard Electrocardio- gram.The monophasic action potential of ventricularmuscle, normally lasts between 0.25 and 0.35 second. The top part of Figure 11–3 shows a monophasic action potential recorded from a micro-electrode inserted to the inside of a single ventricular muscle fiber. The upsweep of this action potential is caused by depolarization, and the return of the poten-tial to the baseline is caused by repolarization.
Note in the lower half of the figure a simultaneous recording of the electrocardiogram from this same ventricle, which shows the QRS waves appearing at
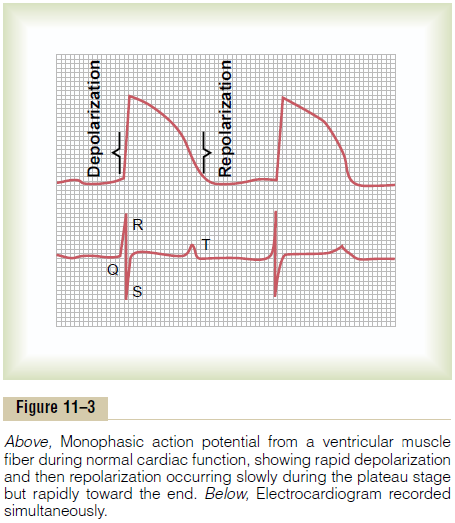
the beginning of the monophasic action potential and the T wave appearing at the end. Note especially that no potential is recorded in the electrocardiogram when the ventricular muscle is either completely polarized or completely depolarized. Only when the muscle ispartly polarized and partly depolarized does current flow from one part of the ventricles to another part, and therefore current also flows to the surface of the body to produce the electrocardiogram.
Relationship of Atrial and Ventricular Contraction to the Waves of the Electrocardiogram
Before contraction of muscle can occur, depolarization must spread through the muscle to initiate the chemi-cal processes of contraction. Refer again to Figure 11–1; the P wave occurs at the beginning of contrac-tion of the atria, and the QRS complex of waves occursat the beginning of contraction of the ventricles. The ventricles remain contracted until after repolarization has occurred, that is, until after the end of the T wave.
The atria repolarize about 0.15 to 0.20 second after termination of the P wave. This is also approxima-tely when the QRS complex is being recorded in the electrocardiogram. Therefore, the atrial repo-larization wave, known as the atrial T wave, is usually obscured by the much larger QRS complex. For this reason, an atrial T wave seldom is observed in the electrocardiogram.
The ventricular repolarization wave is the T wave of the normal electrocardiogram. Ordinarily, ventricular muscle begins to repolarize in some fibers about 0.20 second after the beginning of the depolarization wave (the QRS complex), but in many other fibers, it takes as long as 0.35 second. Thus, the process of ventricular repolarization extends over a long period, about 0.15 second. For this reason, the T wave in the normal elec-trocardiogram is a prolonged wave, but the voltage of the T wave is considerably less than the voltage of the QRS complex, partly because of its prolonged length.
Voltage and Time Calibration of the Electrocardiogram
All recordings of electrocardiograms are made with appropriate calibration lines on the recording paper. Either these calibration lines are already ruled on the paper, as is the case when a pen recorder is used, or they are recorded on the paper at the same time that the electrocardiogram is recorded, which is the case with the photographic types of electrocardiographs.
As shown in Figure 11–1, the horizontal calibration lines are arranged so that 10 of the small line divisions upward or downward in the standard electrocardio-gram represent 1 millivolt, with positivity in the upward direction and negativity in the downward direction.
The vertical lines on the electrocardiogram are time calibration lines. Each inch in the horizontal direction is 1 second, and each inch is usually broken into five segments by dark vertical lines; the intervals between these dark lines represent 0.20 second.The 0.20 second intervals are then broken into five smaller intervals by thin lines, each of which represents 0.04 second.
Normal Voltages in the Electrocardiogram. The recordedvoltages of the waves in the normal electrocardiogram depend on the manner in which the electrodes are applied to the surface of the body and how close the electrodes are to the heart. When one electrode is placed directly over the ventricles and a second elec-trode is placed elsewhere on the body remote from the heart, the voltage of the QRS complex may be as great as 3 to 4 millivolts. Even this voltage is small in com-parison with the monophasic action potential of 110 millivolts recorded directly at the heart muscle mem-brane. When electrocardiograms are recorded from electrodes on the two arms or on one arm and one leg, the voltage of the QRS complex usually is 1.0 to 1.5 millivolt from the top of the R wave to the bottom of the S wave; the voltage of the P wave is between 0.1 and 0.3 millivolt; and that of the T wave is between 0.2 and 0.3 millivolt.
P-Q or P-R Interval. The time between the beginning ofthe P wave and the beginning of the QRS complex is the interval between the beginning of electrical exci-tation of the atria and the beginning of excitation of the ventricles. This period is called the P-Q interval. The normal P-Q interval is about 0.16 second. (Often this interval is called the P-R interval because the Q wave is likely to be absent.)
Q-T Interval. Contraction of the ventricle lasts almostfrom the beginning of the Q wave (or R wave, if the Q wave is absent) to the end of the T wave. This interval is called the Q-T interval and ordinarily is about 0.35 second.
Rate of Heartbeat as Determined from the Electrocardiogram.
The rate of heartbeat can be determined easily from an electrocardiogram because the heart rate is the reciprocal of the time interval between two successive heartbeats. If the interval between two beats as deter-mined from the time calibration lines is 1 second, the heart rate is 60 beats per minute. The normal interval between two successive QRS complexes in the adult person is about 0.83 second. This is a heart rate of 60/0.83 times per minute, or 72 beats per minute.
Related Topics