Chapter: Medical Physiology: Cardiac Output, Venous Return, and Their Regulation
Cardiac Output Curves Used in the Quantitative Analysis
Cardiac Output Curves Used in the Quantitative Analysis
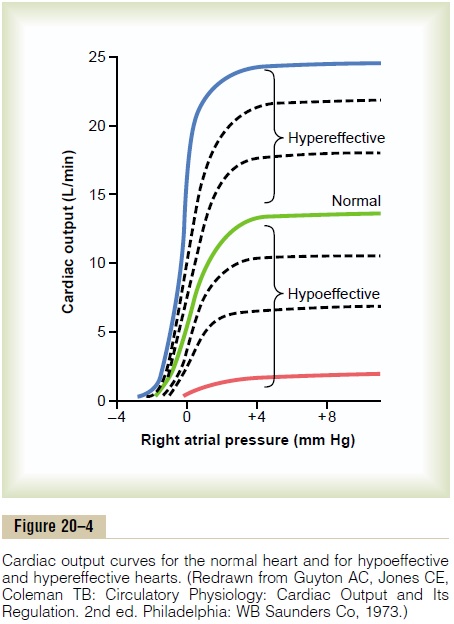
Some of the cardiac output curves used to depict quan-titative heart pumping effectiveness have already been shown in Figure 20–4. However, an additional set of curves is required to show the effect on cardiac output caused by changing external pressures on the outside of the heart.
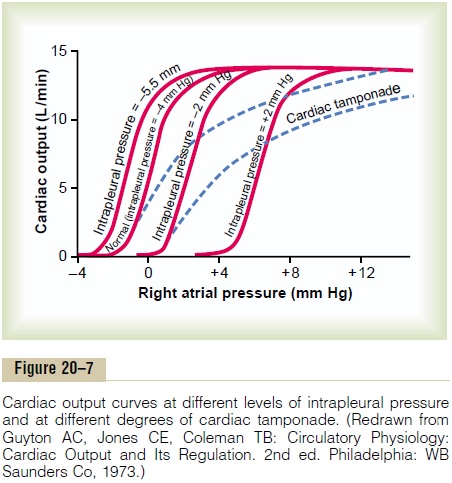
Effect of External Pressure Outside the Heart on Cardiac Output Curves. Figure 20–7 shows the effect of changes in exter-nal cardiac pressure on the cardiac output curve. The normal external pressure is equal to the normal intrapleural pressure (the pressure in the chest cavity), which is -4 mm Hg. Note in the figure that a rise in intrapleural pressure, to -2 mm Hg, shifts the entire cardiac output curve to the right by the same amount. This shift occurs because to fill the cardiac chambers with blood requires an extra 2 mm Hg right atrial pres-sure to overcome the increased pressure on the outside of the heart. Likewise, an increase in intrapleural pres-sure to +2 mm Hg requires a 6 mm Hg increase in right atrial pressure from the normal -4 mm Hg, which shifts the entire cardiac output curve 6 mm Hg to the right.
Some of the factors that can alter the intrapleural pressure and thereby shift the cardiac output curve are the following:
1. Cyclical changes of intrapleural pressure during respiration, which are about±2 mm Hg duringnormal breathing but can be as much as ±50 mm Hg during strenuous breathing.
2. Breathing against a negative pressure, which shiftsthe curve to a more negative right atrial pressure (to the left).
3. Positive pressure breathing, which shifts the curve tothe right.
4. Opening the thoracic cage, which increases theintrapleural pressure to 0 mm Hg and shifts the cardiac output curve to the right 4 mm Hg.
5. Cardiac tamponade, which means accumulation ofa large quantity of fluid in the pericardial cavity around the heart with resultant increase in external cardiac pressure and shifting of the curve to the right. Note in Figure 20–7 that cardiac tamponade shifts the upper parts of the curves farther to the right than the lower parts because the external “tamponade” pressure rises to higher values as the chambers of the heart fill to increased volumes during high cardiac output.
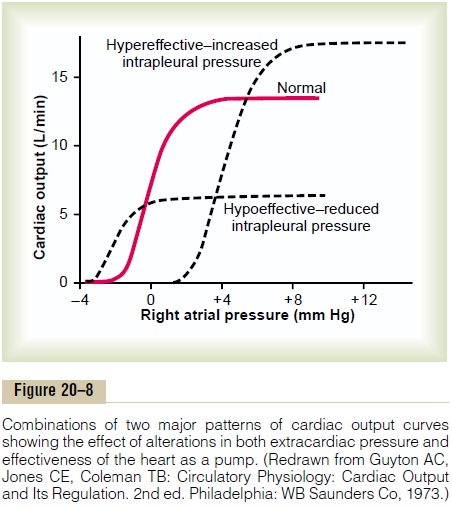
Combinations of Different Patterns of Cardiac Output Curves.
Figure 20–8 shows that the final cardiac output curve can change as a result of simultaneous changes in (a) exter-nal cardiac pressure and (b) effectiveness of the heart as a pump. Thus, by knowing what is happening to the external pressure as well as to the capability of the heart as a pump, one can express the momentary ability of the heart to pump blood by a single cardiac output curve.
Related Topics