Chapter: Mechanical : Engineering Economics & Cost Analysis : Introduction to Economics
Break-Even Analysis
Break-Even Analysis
The main objective of break-even analysis is to find the cut-off production volume from where a firm will make profit.
Let
s = selling price per unit v = variable cost per unit FC = fixed cost per period Q = volume of production
The total sales revenue (S) of the firm is given by the following formula:
S = s Q
The total cost of the firm for a given production volume is given as
TC = Total variable cost + Fixed cost
= v Q + FC
· The linear plots of the above two equations are shown in Fig. .
· The intersection point of the total sales revenue line and the total cost line is called the break-even point.
· The corresponding volume of production on the X-axis is known as the break-even sales quantity.
· At the intersection point, the total cost is equal to the total revenue. This point is also called the no-loss or no-gain situation.
· For any production quantity which is less than the break-even quantity, the total cost is more than the total revenue.
· Hence, the firm will be making loss.
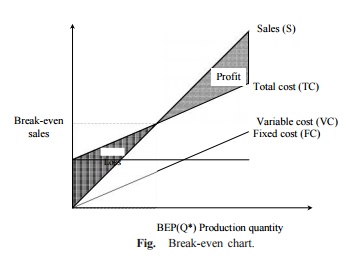
For any production quantity which is more than the break-even quantity, the total revenue will be more than the total cost. Hence, the firm will be making profit.
Profit = Sales – (Fixed cost + Variable costs)
= s Q – (FC + v Q)
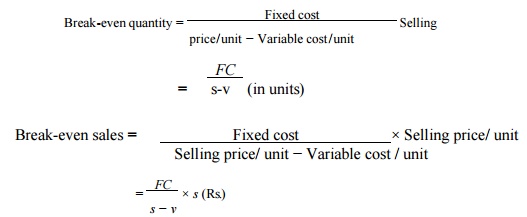
The formulae to find the break-even quantity and break-even sales quantity
Break-even quantity = [ Fixed cost ] / [ price/unit − Variable cost/unit ] Selling
= FC/ s-v (in units)
Break-even sales = [ Fixed cost × Selling price/ unit − Variable cost / unit ] x Selling price/ unit
= [ FC / s − v ] × s (Rs.)
The contribution is the difference between the sales and the variable costs. The margin of safety (M.S.) is the sales over and above the break-even sales. The formulae to compute these values are
Contribution = Sales – Variable costs
Contribution/unit = Selling price/unit – Variable cost/unit
M.S. = Actual sales – Break-even sales
= [ Profit / Contribution ] x sales
M.S. as a per cent of sales = (M.S./Sales) 100
P/V ratio is a valid ratio which is useful for further analysis.
The different formulae for the P/V ratio are as follows:
P/V ratio = Contribution / Sales = Sales − Variable costs / Sales
The relationship between BEP and P/V ratio is as follows:
BEP = Fixed cost / P/V ratio
Related Topics