Chapter: Essential Anesthesia From Science to Practice : Applied physiology and pharmacology : Anesthesia and the lung
Basic pulmonary physiology
Basic pulmonary physiology
Purpose of breathing
Breathing
brings in oxygen necessary for cellular respiration and eliminates the
resulting carbon dioxide. If oxygen supply does not meet demand, desperate
cells revert to anaerobic metabolism, resulting in lactic acidosis.1 Our oxygen requirement depends on the
metabolic rate, but for a resting individual 3 mL O2/kg/min, should
suffice. Meanwhile, we generate CO2 at a rate dependent on the
respiratory quotient “R:”
where V˙C O2 and V˙O2 are the minute
production of carbon dioxide and consump-tion of oxygen, respectively. R depends on the energy source
(carbohydrates, proteins, fat). R
approaches 1 in several conditions including pregnancy and patients on total
peripheral nutrition (TPN), but we usually peg it at 0.8.
Control of breathing
Can you
commit suicide by simply not breathing or by willing your heart to stop? Even
though we have voluntary muscular control over ventilation, we cannot stop
breathing. We are hard-wired so that, in response to rising carbon dioxide
tensions in the medulla, carbon dioxide-sensitive neurons stimulate ventilation
to keep the arterial partial pressure of CO2 (PaCO2) near
40 mmHg. In physiological sleep, they let the PaCO2 drift up to 45
mmHg, while in pregnancy, they are reset by the controller to maintain 30 mmHg.
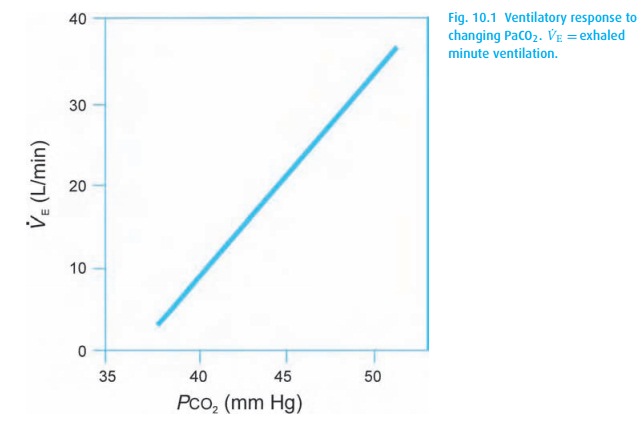
Within physiological limits, ventilation and PaCO2 (Fig. 10.1) keep a linear relationship.
We can
restrain the center pharmacologically with opioids or deep inhala-tion
anesthesia. In some diseases resulting in high PaCO2, the
respiratory center fatigues permanently, and these “CO2 retainers”
must then rely on hypoxemia to drive their ventilation.
Perhaps
surprisingly, oxygenation is not detected in the brain at all, but rather is
sensed by peripheral chemoreceptors in the carotid and aortic bodies. These
receptors do not really kick in until the PaO2 falls below about 60
mmHg. Thus, our “CO2-retaining” patients with chronic obstructive
pulmonary disease (COPD) are not only chronically hypercarbic, they are also
(at least borderline) hypoxemic. We often hear it said that such a patient will
become apneic if given supplemental oxygen. Please do not take this to mean
that, in an emergency, oxygen should be withheld from a hypoxemic patient for
fear of apnea! Instead, give oxygen and ventilate the patient’s lungs. Once on
top of the emergency, turn down the FiO2 step by step and remind the
patient to breathe (no small task) until the oxygen saturation falls to a point
where hypoxic drive takes effect. Similarly, when wean-ing these patients from
mechanical ventilation, they might not start to breathe until returned to the
hypoxic and hypercarbic state to which they are accustomed (another curse of
smoking).
Mechanics of ventilation
Spontaneous
ventilation at rest involves generating negative intrathoracic pres-sure (by
lowering the diaphragm and expanding the chest wall), causing air to be drawn
into the lungs. This requires that the upper airway remains patent. In the
presence of an obstruction, e.g., tongue, mass, mechanical, we observe
retrac-tions, particularly around the clavicles and the jugular notch and, in
children, the intercostal spaces. An early sign is a tracheal tug, a little downward movement of the larynx with each
inspiration. A reliable sign of airway obstruction, the tra-cheal tug signals
the recruitment of accessory muscles to maintain gas exchange. Similarly,
pulmonary cripples (advanced emphysema) and patients still partially paralyzed
after anesthesia will show a tracheal tug. Hypoxemic patients weakened by drugs
or muscle disease require immediate assisted ventilation with bag and mask and,
if necessary, establishment of a patent airway.
At rest,
exhalation should be passive and, if it is not, consider asthma or airway
obstruction.
The work of breathing
The
medullary centers control the PaCO2 by altering the minute
ventilation (V˙E ):
V˙E= VT× f
where VT= tidal volume and f= respiratory rate. How these parameters change to maintain minute
ventilation depends on the work of breathing. Because inhaling requires the
work of muscles, it is “costly,” in an energy expenditure sense, to breathe. In
general, a few large breaths are more efficient than many small ones because
all breaths must move the same amount of deadspace volume (about 150 mL for the
average adult, see below). Endotracheal tubes offer much resistance and can
greatly increase the work of breathing. The ventilator will ease this burden by
doing the inspiratory work for the patient. Just as with all other muscles,
disuse leads to reduced strength and stamina. Several investigators continue to
study the optimal amount of respiratory muscle loading to prevent muscle
atrophy and weaning difficulties.
Patients
with low pulmonary compliance, e.g.,
pulmonary fibrosis, tend to breathe rapidly with low tidal volumes because of
the great work required to expand a stiff lung. Compliance (C ) describes the relationship between
volume (V) and pressure (P) in any enclosed space (lung, cardiac
ventricle):

Conversely,
a patient with high airway resistance
cannot move air rapidly through the bronchial tree and tends to breathe slowly,
which decreases turbulence. The resulting shift toward laminar movement of air
increases flow.
Since
resistance decreases as the fourth power of the radius, we can easily see why
even a small amount of bronchospasm so drastically affects air movement, and
why babies with subglottic edema present us with such great difficulties.
Matching of ventilation and perfusion
All the
tubing leading to the alveoli – trachea, large bronchi, endotracheal tube –
serves only as a conduit. These make up the deadspace volume: areas with
bi-directional airflow but no gas exchange. There are three types of deadspace:
·
physiologic – areas of the normal lung with ventilation but no
perfusion – as found in the apices;
·
anatomic – trachea and bronchi, which lack alveoli altogether;
·
apparatus – the endotracheal tube and other pieces of tubing with
bidirectionalgas flow.
An
endotracheal tube will decrease the anatomic dead space generated by the
pharynx, nose, and mouth. Applying a face mask will increase deadspace, but an
anesthesia breathing circuit will add relatively little to the deadspace as
long as the valves in the circuit function normally. The deadspace to tidal
volume ratio is measured as:
VD/ VT=(PAC O2− PE C O2)/ PAC O2
where VD= deadspace volume, PACO2= alveolar CO2 and PE
CO2= mixed expired CO2. A normal VD/VT ratio should not exceed 0.3.
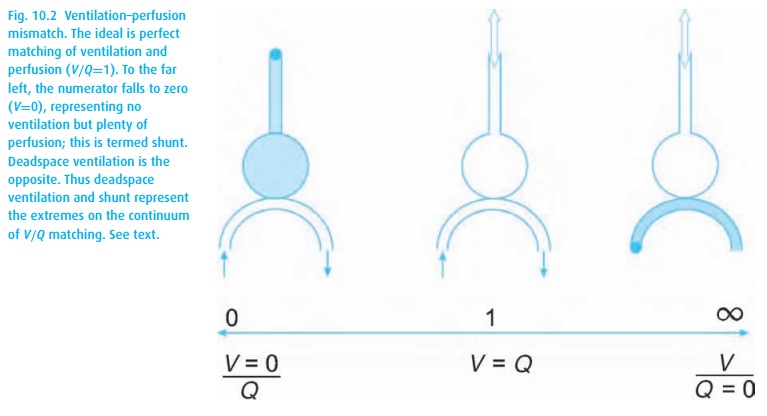
When pulmonary arterial blood manages to pass through the lungs without picking up oxygen or delivering carbon dioxide, we are referring to shunting. A shunt wastes perfusion. Typically, the difference between arterial and end-expired gases increases when ventilation and perfusion are mismatched, either owing to deadspace ventilation (inspired gas returns without having picked up carbon dioxide or delivered oxygen) or to shunting (pulmonary arterial blood bypasses alveoli and then dumps blood high in CO2 and low in O2 into the pulmonary venous blood, see Fig. 10.2). Even normal lungs have some deadspace ventilation and shunting. When either becomes excessive, we refer to a V/Q mismatch evident in abnormal blood gas values.
Tissue oxygenation
Once we
get both air and blood into the lungs, oxygen must traverse the alve-olar
membrane. Oxygen diffusion across this membrane depends on the Fick2 Equation:
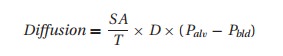
where SA
= surface area of the alveoli (decreased in emphysema); T= membrane thickness (increased with pulmonary edema), D= diffusion constant for a given gas,3
and Palv−Pbld= the gas pressure difference across the membrane dividing alveolus
from blood.
After
traversing the alveolar and capillary wall membrane, oxygen dissolves in plasma
(not much; 0.003 × PaO2) and binds with hemoglobin (a
bunch), and the arterial oxygen content (CaO2) becomes
C aO2=1.34×[Hgb]× SaO2+0.003× PaO2
where
CaO2= volume of oxygen in 100 mL blood, Hgb = hemoglobin concentra-tion, and SaO2= arterial hemoglobin saturation with oxygen.
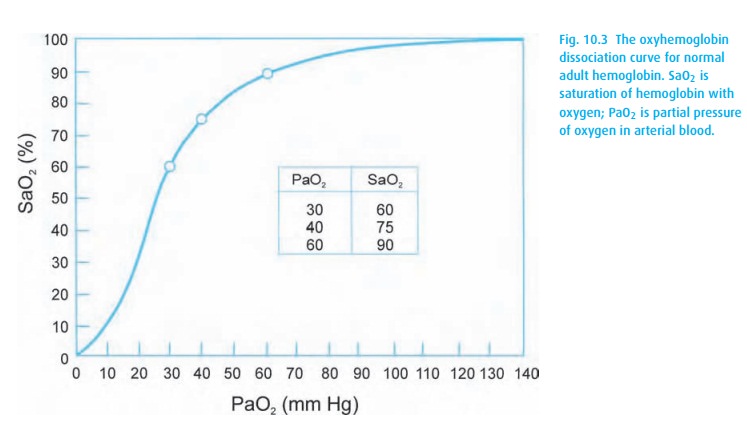
Oxyhemoglobin dissociation curve
The
amount of oxygen bound to hemoglobin depends on the qualities of the hemoglobin
molecule. The familiar oxyhemoglobin dissociation curve appears in Fig. 10.3. Observe the steep part of the curve where
small changes in PaO2 result in large shifts in saturation. The
point of 50% saturation (P50) provides a helpful reference. In
adults, it hovers around 26 mmHg (the hemoglobin will be 50% saturated with
oxygen at a PaO2 of 26 mmHg). The left shift of fetal hemoglobin
brings its P50 to 19 mmHg.
A simple
mnemonic helps to define several points on the oxyhemoglobin dis-sociation
curve: 30–60; 60–90; 40–75 (Fig. 10.3). It
does not sound much like a mnemonic, but put it to a beat and it works quite
well. The first number of each pair cites the PaO2, followed by the
SaO2. We use this to estimate (roughly) the PaO2 from the
SpO2 (obtained from the pulse oximeter). A PaO2 of 60
mmHg or less defines hypoxemia (SpO2∼90%), and 40 mmHg is the normal mixed venous PO2.
Four
factors influence the position of the oxyhemoglobin dissociation curve. For
ease of memorization, we cite those factors that shift the curve to the right: increasing temperature, CO2,
H+, and 2,3-diphosphoglycerate (DPG). RememberpH
decreases with increasing [H+ ].
Alveolar air equation
The PO2
we expect to find in arterial blood depends, in large part, on the inspired
concentration. Oxygen makes up approximately 21% of the volume of dry air. If
we assume the ambient (sea level) pressure to be 760 mmHg, the partial pressure
of oxygen in dry air would be 160 mmHg (760 × 0.21). The warm and moist airways add water (water vapor pressure
is temperature-dependent, and at 37 °C it is 47 mmHg). Thus, breathing room
air, our inspired oxygen concentration (PiO2) on its way through the
nose and upper airway will be diluted by water vapor:
PiO2= (760 − 47) × 0.21 = 150 mmHg
Once it
arrives in the alveolus, this inspired oxygen will be diluted by carbon dioxide
and taken up into the bloodstream. Summarized mathematically,4 the resulting equation is too cumbersome
for clinical application. Instead, we use the approximation commonly referred
to as the alveolar air equation:
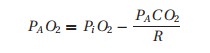
where
the “A” subscript denotes alveolar gas.
If we
take the trouble of calculating for a person breathing room air (PiO2= 150 mmHg), assuming R= 0.8 and PACO2= 40 mmHg, we arrive at a PAO2
of about 100 mmHg. You can easily see that many factors can change the results:
altitude, retention or rebreathing of CO2, changing the
concentration of oxygen in the inspired gas, changing the respiratory quotient,
or changing the patient’s temperature.
Clinical relevance of the oxyhemoglobin dissociation curve
Notice
on the curve (Fig. 10.3), if a patient has
an oxyhemoglobin saturation of 100%, we know that the PaO2 must be
at least 100 mmHg, but it could be anywhere from about 100 to 600 mmHg or more!
We see the importance when administering supplemental oxygen in two different
scenarios that follow.
The hypoxemic patient
When a
patient becomes hypoxemic, we first apply supplemental oxygen. Won-derfully,
the patient’s saturation usually responds. Should it fall again, we can simply
increase the inspired oxygen concentration once again – but we are not solving
the problem. The adequate saturation may lull us into an inappropriate sense of
security regarding the well-being of the patient.
Assume
this patient requires 50% inspired oxygen to maintain a SpO2 of 90%,
much less than we would expect with that FiO2. We estimate the
degree of the oxygenation problem by looking at the difference between the
alveolar and arterial oxygen concentrations. With a SpO2 of 90%, we
can assume the PaO2 to be around 60 mmHg (from Fig. 10.3).
Next, we
need to know what the alveolar concentration of oxygen would be in the patient
breathing 50% oxygen. The alveolar air equation comes to our aid. We estimate PACO2 and R to be 40 mmHg and 0.8, respectively.
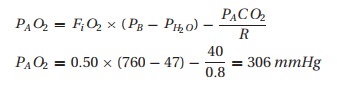
Therefore,
we would expect the PaO2 to be close to 300 mmHg instead of the
observed 60 mmHg. This “A-a difference” (often mislabeled an A – a gradient)
may be due to a problem with oxygen diffusion and/or matching of ventilation
and perfusion (V/Q). In healthy patients some 4% of the venous blood will manage to
make it through a right (venous blood in the pulmonary artery) to left
(arterial blood in the pulmonary vein) shunt. Thus, normally we expect to see a
slightly lower partial pressure of oxygen in arterial blood than in alveolar
gas. However, a patient requiring 50% inspired oxygen to barely maintain a SpO2
of 90% should worry us greatly.
If a
patient is hypoxemic on room air, giving supplemental oxygen is a great first
step, but the source of the hypoxemia
should be sought and appropriately treated.
Conscious sedation
The
patient receiving intravenous sedation presents another situation in which the
alveolar air equation can help. Some physicians routinely place these patients
on supplemental oxygen by nasal cannula, resulting in a PaO2 of 150
mmHg or more (well into the flat part of the oxyhemoglobin dissociation curve:
Fig. 10.3). If the patient now
hypoventilates, his PaCO2 will rise and PaO2 will fall,
but his SpO2 can stay deceptively normal. Thus, not giving supplemental oxygen (to a patient with normal
oxygenation) will make the SpO2 a sensitive indicator of respiratory
depression. Once a drop in saturation occurs, we need to treat the patient’s
hypoventilation.
Related Topics